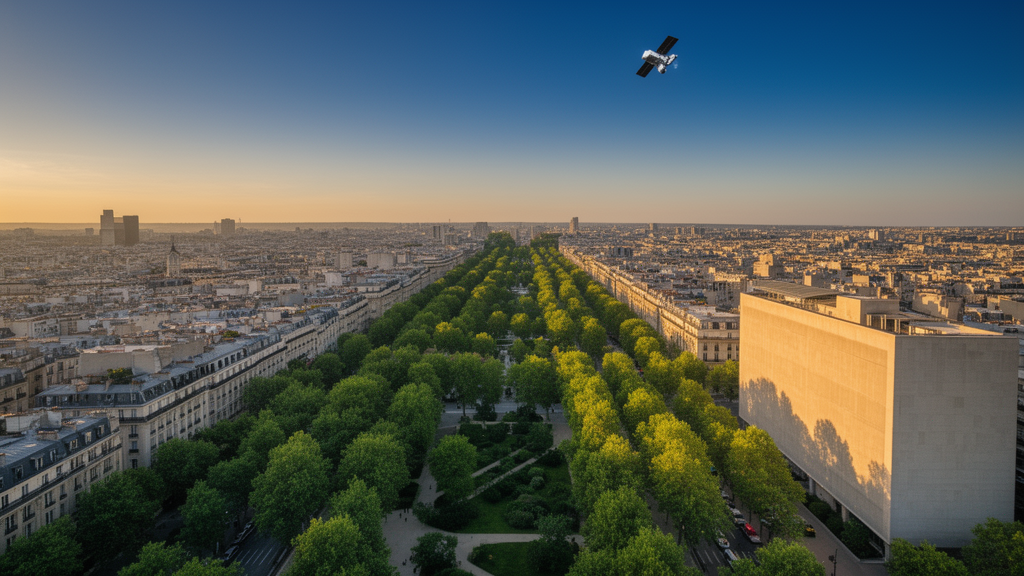
Urban green spaces do more than decorate a city map. They measurably change how hot and stressful an outdoor environment feels, and a new study published in Computational Urban Science reports a two-stage method for mapping those spaces from high-resolution satellite images and then simulating their effect on thermal comfort. Using imagery from 2010 to 2024 across ten Chinese cities, with a detailed case study of Hangzhou, the researchers report that their extraction pipeline reached an average accuracy of 95.15 percent while cutting processing time to an average of 51.97 milliseconds, outperforming three comparison methods built on conventional vegetation-index approaches.
The core problem the team set out to solve is a familiar one in remote sensing. The most widely used vegetation index, the Normalized Difference Vegetation Index, or NDVI, compares reflectance in the near-infrared and red bands to flag vegetation. But water bodies and building shadows can produce NDVI values similar to those of vegetation, because all three appear as low-reflectivity or spectrally ambiguous areas in an image. The result is misclassification: ponds counted as parks, shaded pavement counted as canopy. The authors describe this as the main weakness of methods that rely on a single index or simple spectral analysis, and it motivated the design of their first extraction method, which they call Method 1.
Method 1 introduces two engineered features. The first, an anti-interference green space recognition feature labeled C_d, reworks the NDVI band ratio by expanding the ratio of numerator to denominator, which the authors say amplifies the reflectance difference between vegetation and water. They report reference value ranges of roughly 0.65 to 0.90 for vegetation and 0.10 to 0.35 for water bodies, giving classifiers a wider separation margin than NDVI provides. The second feature targets shadows at the object level rather than the pixel level. The Segment Anything Model, a general-purpose image segmentation model, first divides the image into shadow and non-shadow regions; within each segmented object, features from the Hue-Saturation-Intensity color space are aggregated and clustered into shadow and non-shadow classes. Different vegetation-index strategies are then applied to shadowed and unshadowed areas, and the results are merged into a final green space map.
Because even this pipeline leaves residual noise, the researchers added a second stage, Method 2, built on the InternImage network serving as the backbone of the UPerNet segmentation framework. InternImage uses deformable convolution operations that dynamically adjust the receptive field, which the authors credit with adapting to green space targets of different scales and shapes. UPerNet fuses multi-scale features through a pyramid pooling module and a classification head that outputs a binary green or non-green map. Trained on 35,000 image tiles of 256 by 256 pixels cropped from GF-2 satellite data, with annotations by two remote sensing professionals verified at a Kappa coefficient of 0.92, Method 2 achieved accuracy ranging from 94.28 to 97.34 percent, while the maximum accuracy of three comparison segmentation models stayed below 92 percent. It also used less computing power, with maximum CPU utilization of 11.37 percent and maximum memory usage of 12.09 percent, lower than all comparison models.
Ablation experiments helped quantify what each component contributes. Starting from a baseline NDVI extraction accuracy of 82.56 percent, adding the anti-interference feature improved accuracy by 4.63 percentage points, and the object-level shadow processing added another 8.30 points; the deep-learning refinement stage contributed a further 0.34 points, for a cumulative gain of 13.27 points. The authors argue that the deep-learning stage matters less for average accuracy than for edge quality and robustness: across a validation subset of 1,000 tiles, the intersection-over-union score for edge pixels rose from 0.83 to 0.93, cross-city accuracy fluctuation narrowed from plus or minus 1.73 percent to plus or minus 0.86 percent, and the misclassification rate under extreme conditions fell from 7.45 to 3.92 percent. Misclassification between water and vegetation dropped from 15.37 to 3.19 percent in the full framework.
To connect green space patterns to actual thermal conditions, the team used ENVI-met microclimate simulation software on a Hangzhou study area of 1,120 by 1,440 meters, with an original grid resolution of 8 by 8 by 4 meters aggregated into 50 by 50 meter analysis units, 12,460 of them in total. They validated the simulation against field measurements on two summer days, July 17 and July 28, 2025, when the highest recorded temperatures were 37.21 and 40.39 degrees Celsius. Simulated humidity differed from measurements by at most 1.17 percent on the first day and 1.09 percent on the second, while simulated temperature differences ranged from 0.08 to 1.59 degrees Celsius. Index-of-agreement values exceeded 0.95 for temperature and humidity, and validation of three thermal comfort indices, including physiological equivalent temperature, also showed low errors and consistency indices of 0.94 or higher.
The correlation analysis linked green space pattern indicators to thermal stress. The proportion of green space area correlated negatively with the thermal stress index at r = -0.60, and aggregation degree correlated even more strongly at r = -0.70, while patch density showed a weak positive correlation of r = 0.30 and the landscape shape index was essentially uncorrelated at r = 0.02. In a multiple linear regression controlling for building density, building height, wind speed and temperature, green space aggregation was significantly negatively associated with physiological equivalent temperature, with a regression coefficient of -0.674 and p < 0.001, while air temperature had the strongest positive effect at 0.712. The authors also note internal structure in the pattern indicators themselves: area proportion and aggregation degree correlated strongly with each other at r = 0.72, and both correlated negatively with patch density.
Across Hangzhou’s administrative regions from 2010 to 2024, the area and proportion of tree, shrub and herbaceous green space all increased. Region F showed the largest gains, with about 10.69 square kilometers of new tree canopy, the largest shrub and herbaceous growth of the six regions, and the highest proportional increases, at 3.93 percent for trees, 3.37 percent for shrubs and 1.95 percent for herbs. Landscape indicators moved in parallel: patch density declined, fragmentation decreased, patch shapes became more regular, and aggregation and connectivity strengthened, with region F again the most prominent. In the thermal simulations, region F recorded the smallest physiological equivalent temperature values, a thermal stress index minimum of 21.09, and thermal comfort index values closest to the range the authors describe as suitable for human comfort, while region B showed the highest PET values at up to 32.51.
The authors frame the practical message cautiously but clearly: in their Hangzhou case study, districts with larger, more contiguous green space showed better simulated thermal comfort, and the pattern indicators most strongly associated with lower thermal stress were high area proportion and high aggregation. They suggest this supports planning that expands green coverage and consolidates patches rather than scattering small ones, though they stress that the correlation analysis covers only one city and cannot by itself establish how green space changes would play out elsewhere. The study also has stated limitations: the thermal comfort assessment does not account for individual differences in age, gender or activity level, and the green space-thermal comfort analysis is limited to Hangzhou, which the authors acknowledge limits regional representativeness.
Technical caveats accompany the headline numbers. The SAM-based shadow segmentation required manual correction on roughly 3 percent of images, mainly in dense shadow areas of urban centers, and its accuracy drops by about 10 percent on lower-resolution imagery such as Landsat 8, performing best during summer when vegetation is lush. The remote sensing data itself is subject to a satellite data sharing protocol, with code available from the corresponding author under academic conditions. Even with those constraints, the study offers a documented, quantitatively validated pipeline, from 2-meter-resolution satellite imagery through noise-cleaned green space maps to microclimate simulation, and a fifteen-year record suggesting that as Hangzhou’s green space grew and clumped together, its simulated outdoor thermal stress declined.
Subject of Research: A remote sensing and simulation study of how urban green space patterns affect thermal comfort in Chinese cities
Article Title: Green space pattern and thermal comfort simulation based on high-resolution remote sensing images
Article References: Jiang, Y., Hao, Y., Wang, L., & He, J. (2026). Green space pattern and thermal comfort simulation based on high-resolution remote sensing images. Computational Urban Science, 6(1), Article 55. https://doi.org/10.1007/s43762-026-00289-y
Image Credits: AI Generated
DOI: 10.1007/s43762-026-00289-y
Keywords: urban green space, thermal comfort, remote sensing, NDVI, ENVI-met, Hangzhou, InternImage, UPerNet, Segment Anything Model, physiological equivalent temperature, urban heat island, landscape pattern
News Source: Denise Maddox. (October 29, 2026). Smarter Satellite Mapping Shows How Urban Green Space Shapes City Heat Comfort. Scienmag.