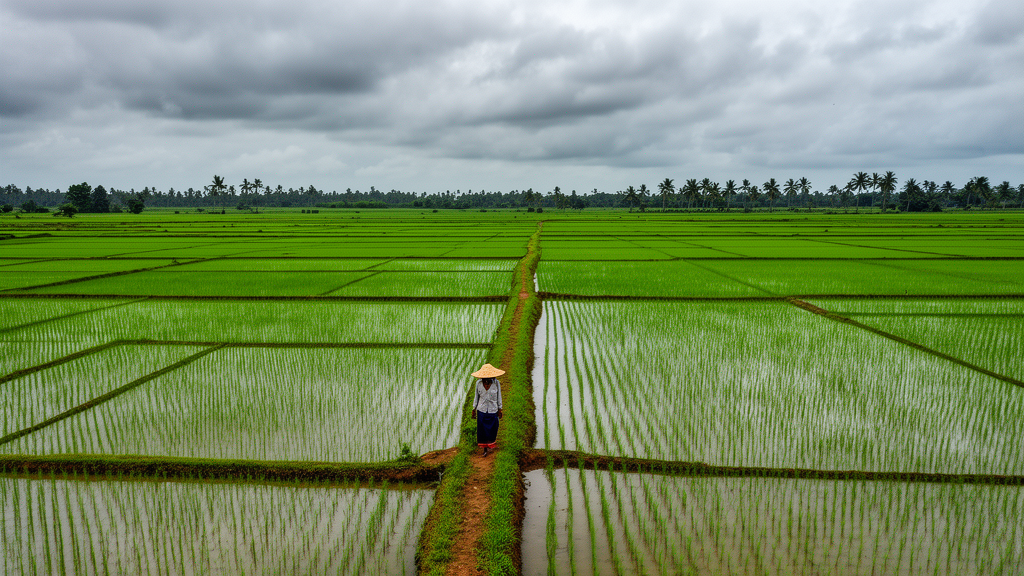
In the Cauvery Delta of Tamil Nadu, India, monsoon clouds routinely blind the optical satellites that agricultural agencies rely on, leaving farmers and planners without reliable maps of where rice is actually grown. A new study reports that radar from the Sentinel-1 satellites, combined with a single vegetation index from Sentinel-2, can classify rice, other vegetation and built-up land at about 72 percent accuracy — and, perhaps more strikingly, that a plain logistic regression outperformed a purpose-built neural network. The reason, the authors argue, is not the algorithm but the quality of the reference labels used to train and test it.
The study, published in Frontiers in Sustainable Food Systems, covered roughly 1,460 square kilometres of the central delta around Kumbakonam, spanning latitudes 10.85°N to 11.15°N and longitudes 79.05°E to 79.45°E, over the agricultural year from 1 June 2024 to 31 May 2025. This region supports three successive paddy seasons — Kuruvai, Samba and Thaladi — and its alluvial clay-loam soils underpin some of the most intensive rice cultivation in peninsular India. But the same monsoon that waters the fields, particularly the northeast monsoon from October to December, systematically blocks the cloud-dependent optical sensors that would otherwise track them.
Sentinel-1 sidesteps that problem. Its C-band synthetic aperture radar, operating at 5.405 GHz, sends out microwave pulses and records the echoes, penetrating cloud and working without sunlight. The researchers assembled 29 acquisition dates between 9 June 2024 and 23 May 2025 in VV and VH polarisations at 10-metre resolution. Because Sentinel-1B has been non-operational since December 2021 and Sentinel-1C only began acquisitions in December 2024, the effective repeat cycle across most of the study window was 12 days from Sentinel-1A alone, with one 24-day gap in late July and August 2024.
To test how much radar actually adds, the team drew a random sample of 500 points across the delta and labelled each one by visual interpretation of high-resolution imagery, cross-checked against seasonal Sentinel-2 composites. After excluding 50 points that fell into other categories such as water or bare soil, 449 points remained: 149 rice, 256 vegetation and 44 built-up. At each point, Google Earth Engine supplied the annual NDVI from Sentinel-2, annual Sentinel-1 VV, VH and VV/VH values, and a 29-date radar time series condensed into 12 summary statistics, including the mean, standard deviation, minimum, maximum, range and timing of the annual minimum for each polarisation.
The results were unambiguous about where the information lies. Under cross-validation with whole 1-kilometre blocks held out — a conservative design that prevents neighbouring points from inflating scores — NDVI alone reached only 51.6 to 55.8 percent accuracy, below the 57.0 percent achieved by simply guessing the majority class. Adding the three annual radar features lifted accuracy to 62.7 to 67.0 percent, and replacing them with the 12 radar time-series summaries alongside NDVI pushed it to 70.7 to 72.4 percent. The best model, logistic regression on the 13 time-series features, reached 72.4 percent accuracy with a Cohen’s kappa of 0.475, a statistically significant improvement over the neural network on annual features (McNemar p = 0.001).
The single most informative feature was the temporal standard deviation of VH backscatter, which scored 0.151 in permutation importance — roughly twice the contribution of NDVI. That makes physical sense: a paddy field cycles from open, flooded water at transplanting, when the smooth surface reflects radar energy away from the sensor, to a dense canopy weeks later, producing large swings in cross-polarised backscatter that orchards, sugarcane and village rooftops do not show. Annual median values average away exactly this signature, which is why the time-series summaries outperformed them by five to nine percentage points.
Just as telling was what did not help. The fully connected neural network, named HydraSAR-DNN despite having no modality-specific branches, never beat the best simpler classifier on any of the six feature sets tested. Random Forest came within two percentage points of logistic regression, with overlapping confidence intervals. With only 449 training points, the authors conclude, model complexity is not the bottleneck — and the bottleneck they identified is more fundamental than sample size alone.
To quantify reference-label reliability, a second interpreter who could not see the first interpreter’s labels independently annotated the first 100 points. The two agreed on 68.4 percent of them (kappa 0.516), with disagreement concentrated almost entirely on the rice-versus-vegetation boundary — precisely where the classifiers also made most of their errors. Among the 84 points both interpreters placed in the three analysis classes, agreement was 70.2 percent. The classifiers, in other words, reproduce the reference labels about as consistently as a second human does, suggesting that accuracy estimates in studies without independent label checks may be optimistic, and that better reference data — field surveys or adjudicated multi-date interpretation — would do more for this application than any deeper network.
Spatial robustness held up reasonably well for a sparse sample whose points sit a median 0.89 kilometres apart: holding out whole 1-kilometre blocks changed accuracy by no more than 2.4 percentage points compared with random folds, and 2-kilometre and 5-kilometre blocks gave similar results for the annual-feature models. The authors caution that this comparison does not rule out spatial dependence at larger scales or in denser samples, and that transfer to other regions or years would require retraining and local evaluation. Built-up land, with only 44 sample points, carries wide uncertainty, and many village houses sit under tree canopy, which explains why built-up points were confused with vegetation rather than rice.
Alongside the classifier, the team built Delta AgriOS v7.0, a Streamlit dashboard prototype presenting the classification output next to an evapotranspiration-based irrigation planner, a rule-based pest-risk indicator covering threats such as brown planthopper and rice blast, and trilingual SMS templates in English, Tamil and Hindi. The authors are explicit that these modules run on placeholder inputs, have not been field-tested, and that claimed contributions to the Sustainable Development Goals on hunger, water and climate remain to be demonstrated through controlled trials. What the study does deliver is a reproducible, openly released baseline — reference sample, extracted features and analysis code — for a monsoon-dependent delta, evaluated with spatially separated test data, simple baselines and an unusually honest account of how far its labels can be trusted.
Subject of Research: Sentinel-1 SAR and Sentinel-2 optical classification of rice, vegetation and built-up land in the monsoon-affected Cauvery Delta
Article Title: Sentinel-1 SAR and Sentinel-2 optical land-cover classification with a prototype decision-support dashboard for the monsoon-driven Cauvery Delta
Article References: Rithikkaa, S. J., Rahul, S. G., Amirthalakshmi, T. M., & Gayathri, M. (2026). Sentinel-1 SAR and Sentinel-2 optical land-cover classification with a prototype decision-support dashboard for the monsoon-driven Cauvery Delta. Frontiers in Sustainable Food Systems, 10, 1875985. https://doi.org/10.3389/fsufs.2026.1875985
Image Credits: AI Generated
DOI: 10.3389/fsufs.2026.1875985
Keywords: Sentinel-1, Sentinel-2, SAR, land-cover classification, Cauvery Delta, rice, remote sensing, Google Earth Engine, cross-validation, reference data, NDVI, decision-support dashboard
News Source: Alan Morgan. (October 28, 2026). Simple model beats deep learning mapping monsoon-hidden rice in Cauvery Delta. Scienmag.