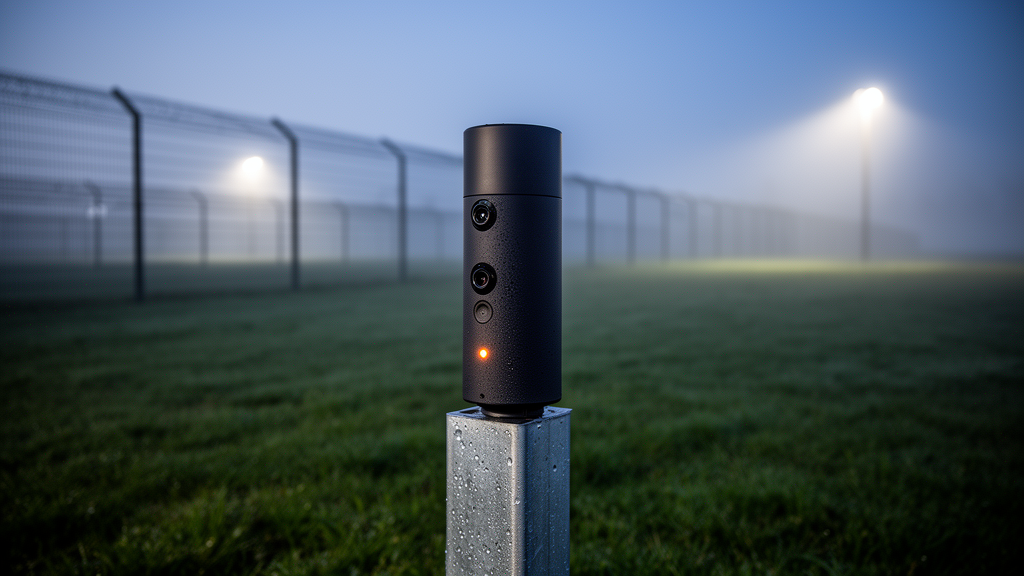
A computational evaluation of barrier coverage models has identified sensor sensing range as the predominant network parameter governing intrusion detection capabilities in wireless sensor networks. In a newly published study examining synthetic benchmark data from the UCI Machine Learning Repository, researchers Lei Yang, Chunbaixue Yang, and Cheng Zha investigated how physical network configurations influence barrier formation against unauthorized traversals. Across evaluated regression architectures, predictive modeling demonstrated that variations in sensing range contributed far more significantly to model estimates than network area, node density, or sensor transmission reach. These findings provide empirical guidance for network designers who must strategically allocate finite computational, sensing, and energy budgets across vulnerable boundary monitoring regions.
Wireless sensor networks represent decentralized systems composed of compact, homogeneous sensor nodes deployed without pre-installed base infrastructure to monitor physical spaces. Across military and civilian applications such as border security, disaster management, and critical infrastructure surveillance, sensor networks serve as operational sentinels designed to detect unpermitted incursions. Traditionally, network barrier coverage models measure the probability that an unauthorized intruder moving through a designated region of interest will be detected by active sensing perimeters. However, validating multi-parameter barrier coverage configurations has historically relied on extensive Monte Carlo simulations, which can require approximately fifteen hours per simulation run and scale exponentially when analyzing large sensor counts and broad operational settings.
To overcome the computational bottlenecks associated with iterative Monte Carlo simulations, the researchers reframed intrusion detection barrier analysis as a machine learning regression task. Rather than outputting discrete attack classifications, the computational pipeline was designed to predict the continuous number of formed detection barriers across varying network architectures. The analytical workflow incorporated two distinct machine learning models: the Radial Basis Function network, which models complex multivariate interactions using distance-based basis kernels, and the Light Gradient Boosting Machine, an ensemble framework that grows decision trees leaf-wise to optimize processing efficiency. To refine these predictive architectures, the team integrated the nature-inspired Rider Optimization Algorithm to iteratively optimize hyperparameter configurations such as learning rates, tree depth, and estimator counts.
The underlying investigation evaluated the benchmark LT-FS-ID dataset, which comprises exactly 182 synthetic instances modeling barrier coverage scenarios across varied network parameter spaces. The analytical dataset tracked four defined input parameters: monitored network area, sensor sensing range, node transmission range, and the total count of sensor nodes, while setting the resulting number of barriers as the continuous target output. Within the benchmark distribution, the deployment area ranged widely between 5,000 and 50,000 units, averaging 24,375 units with a standard deviation of 15,197.253 and a slight positive skewness of 0.368. The sensing range varied symmetrically between 15 and 40 units, with a mean of 27.5 and a standard deviation of 7.521, whereas sensor node counts ranged symmetrically from 100 to 400 nodes, exhibiting an average of 250 and a standard deviation of 90.248.
Statistical evaluation of the target output demonstrated substantial dispersion in barrier formation across the 182 benchmark cases. The recorded number of detection barriers spanned from a minimum of 12 to a maximum of 320, displaying a mean of 94.071, a standard deviation of 65.171, and a pronounced positive skewness of 1.062. The considerable divergence between the distribution mode of 28 barriers and the calculated mean of 94.071 confirmed that while a large portion of network setups generated modest barrier counts, select parameter combinations yielded disproportionately dense coverage. Initial correlation inspections revealed that increasing sensing range under fixed area conditions directly multiplied barrier counts, while expanding network area under constant sensing range dispersed coverage density, confirming an inverse moderating effect.
During algorithmic hyperparameter tuning via the Rider Optimization Algorithm across 200 iterations, both enhanced regression models demonstrated stable error reduction. Starting from initial root mean square errors near 1.0, both the optimized Radial Basis Function model (RBRO) and the optimized LightGBM model (LGRO) converged rapidly before leveling off after iteration 50. In late-stage iterations past iteration 150, LGRO achieved an extended convergence margin, descending to a final root mean square error of 0.962 compared to 0.979 for RBRO. Across validation and testing checkpoints, the LGRO architecture demonstrated superior generalization stability, producing a test root mean square error of 5.578, a mean absolute relative error of 0.026, and a scatter index of 0.077, outperforming the unoptimized baseline models and standard configurations.
To rigorously diagnose the relative importance of each network factor in determining barrier coverage, the authors coupled their models with SHapley Additive exPlanations sensitivity analysis grounded in cooperative game theory. In the LightGBM regression framework, sensing range yielded the highest individual SHAP value of 45.191, indicating that it exerted the primary control over barrier formation estimates. Network area registered as the second most influential parameter, yielding a SHAP value of 29.286. Conversely, transmission range and sensor node counts each registered SHAP values of 0.000 within the LightGBM formulation, demonstrating conditional redundancy within the analyzed parameter space once sensing range and deployment area were accounted for. In the Radial Basis Function network, sensing range, area, and transmission range recorded uniform SHAP values of 1.524, while node count trailed at 0.730.
Runtime assessments revealed clear operational trade-offs between model accuracy and computational execution overhead. Unoptimized baseline models completed execution in minimal time, with standard LightGBM requiring 9.33 seconds and baseline RBF requiring 12.87 seconds, while classical models like Support Vector Machines and Random Forest demonstrated intermediate runtimes. The iterative metaheuristic search within the Rider Optimization Algorithm substantially increased total processing times to 53.40 seconds for LGRO and 49.95 seconds for RBRO, while a hybrid LightGBM-RBF model achieved an intermediate runtime of 33.40 seconds. Residual analysis further highlighted behavioral distinctions across models, as RBRO confined residuals closely within minus thirty and positive thirty, whereas LGRO exhibited wider residual spreads ranging from minus sixty to positive sixty.
Receiver operating characteristic evaluations were also conducted by converting the continuous barrier targets into binary classification thresholds based on distribution cutoffs. Under this transformation, RBRO attained the highest area under the curve value at 0.978, followed closely by the hybrid model at 0.977, LGRO at 0.974, baseline RBF at 0.971, and baseline LightGBM at 0.964. However, the researchers emphasized that area under the curve remains a secondary metric in continuous regression analyses, where root mean square error takes precedence for network deployments. Because minimizing absolute prediction error is paramount to preventing unmonitored breach paths along border regions, LGRO remained the preferred configuration despite RBRO displaying tighter residual clustering on training splits.
The authors noted significant experimental boundaries that qualify the immediate deployment of these findings in real-time embedded environments. The metaheuristic optimization routines incur substantial computational burdens that exceed the operational capacity of low-power sensor microcontrollers. Furthermore, because training and sensitivity validations were conducted exclusively on the synthetic 182-instance LT-FS-ID dataset, model generalizability to alternative physical topologies, dynamic environmental noise, and physical node mobility remains unverified. The team recommended that future research investigate distributed federated learning protocols, reinforcement learning mechanisms, and lightweight feature selection wrappers to maintain prediction accuracy while minimizing computational and communication overhead across decentralized wireless sensor network architectures.
Earlier intrusion detection research in wireless sensor networks primarily emphasized classification tasks across diverse network attack profiles. Prior investigations demonstrated that LightGBM configurations utilizing SMOTE-Tomek data balancing attained attack detection rates exceeding 99 percent while reducing modeling time by 46 percent, while RBF classifiers surpassed traditional decision trees in identifying sleep deprivation and sinkhole intrusions. Furthermore, boosting approaches evaluated on denial-of-service benchmarks achieved 99.16 percent accuracy, and sequence backward selection combined with LightGBM delivered high F-measures across blackhole, grayhole, flooding, and time-division multiple access attacks. By formulating barrier coverage prediction as a continuous regression problem rather than categorical threat classification, the current investigation provided a complementary framework for modeling the physical barrier density necessary to resist undetected penetration across surveillance zones.
Beyond root mean square error, the comparative analysis assessed model reliability using metrics including Nash-Sutcliffe Efficiency, mean absolute error, and error percentage distributions ranging from minus 60 percent to positive 60 percent. Error histogram profiles revealed that the optimized RBF model achieved the tightest consistency, restricting most prediction errors between minus 20 percent and positive 20 percent. In contrast, unoptimized baseline models exhibited substantial variance during validation testing. Unoptimized LightGBM yielded a coefficient of correlation of 0.896, a root mean square error of 15.434, and a mean absolute relative error of 0.099, while unoptimized RBF produced a validation root mean square error of 14.259 and a mean absolute relative error of 0.086. The hybrid formulation maintained intermediate performance, recording a test root mean square error of 7.889 and a mean absolute relative error of 0.051.
Computational runtime benchmarks also contextualized the practical viability of machine learning against deep learning alternatives, such as Long Short-Term Memory networks that required 43.56 seconds of processing time. Metaheuristic tuning with the Rider Optimization Algorithm operated with a population of 30 candidate solutions over 200 iterations, simulating cooperative maneuvers and aggressive acceleration to avoid local minima. The authors concluded that such diagnostic sensitivity evaluations offer actionable guidance for deploying resource-efficient sensor networks across diverse civilian and industrial contexts, including precision agriculture, smart city infrastructure, and industrial equipment monitoring.
Subject of Research: Evaluation of high-impact network parameters on intrusion detection barrier coverage in wireless sensor networks
Article Title: Diagnostic evaluation of high-impact features on intrusion detection performance in wireless sensor networks
Article References: Yang, L., Yang, C., & Zha, C. (2026). Diagnostic evaluation of high-impact features on intrusion detection performance in wireless sensor networks. Journal of Engineering and Applied Science, 73(1), Article 468. https://doi.org/10.1186/s44147-026-01321-y
Image Credits: AI Generated
DOI: 10.1186/s44147-026-01321-y
Keywords: wireless sensor networks, intrusion detection systems, sensing range, barrier coverage, machine learning regression, LightGBM, radial basis function, rider optimization algorithm, SHAP sensitivity analysis, network parameters, root mean square error, UCI machine learning repository, computational modeling, node density, transmission range, hyperparameter optimization, network security
News Source: Denise Maddox. (November 19, 2026). Sensing Range Strongly Drives Intrusion Detection Performance in Sensor Networks. Scienmag.