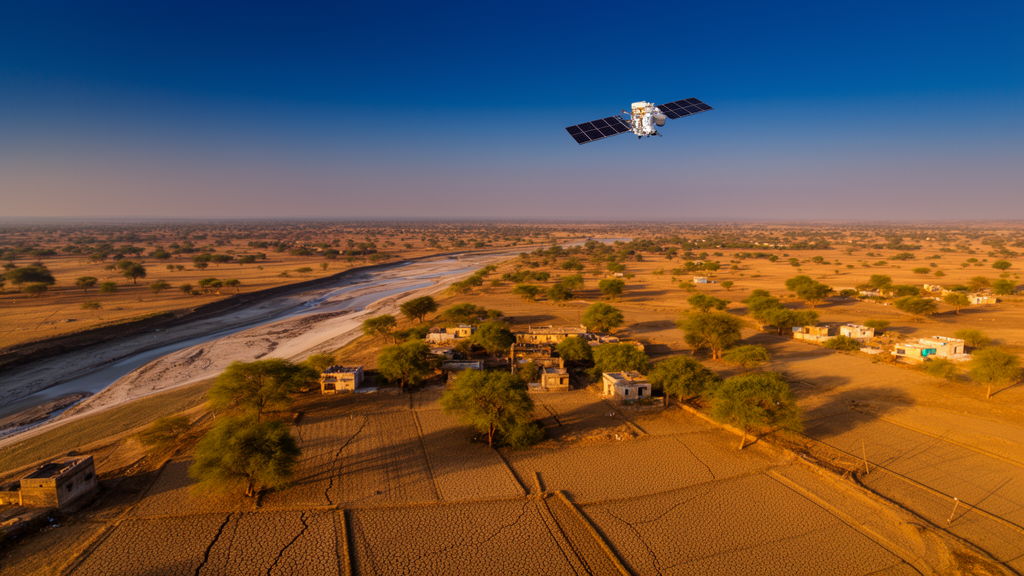
A 26-year analysis of satellite records from southeastern Rajasthan has uncovered a mismatch that could reshape how drought is monitored in one of India’s key rainfed agricultural regions. Researchers examined the Hadoti region, comprising the districts of Kota, Bundi, Baran and Jhalawar, using three vegetation indices derived from Landsat imagery between 1997 and 2022, and found that annual composites of satellite data systematically understate drought stress during the monsoon cropping season. From 2015 to 2022, the annual product placed 14.8 percent of the region in severe or extreme drought, while the Kharif, or monsoon-season, product placed 25.8 percent there. The gap appeared in every district, and in 2020 the annual composite flagged only about 5 percent of the region as severely stressed while the Kharif composite flagged about 27 percent.
The study, published in Discover Plants, combined the Normalized Difference Vegetation Index (NDVI), the Normalized Difference Water Index (NDWI) and the Vegetation Condition Index (VCI) computed from surface reflectance imagery of Landsat 5, 7, 8 and 9. All image processing was performed in Google Earth Engine, with clouds and other unsuitable pixels masked out before analysis. Indices were calculated only for cropland pixels, identified using the ESA WorldCover 2021 map, and the same static mask was applied across all years. Because different Landsat sensors can introduce artificial reflectance differences, imagery from the older sensors was harmonized to Landsat 8 equivalents using published regression coefficients. Three compositing windows were used: an annual window spanning January to December, a Kharif window from June to October covering the monsoon cropping season, and a Rabi window from November to April capturing the winter cropping season.
The most striking single finding concerned the year 2010. All four districts fell into the extreme agricultural drought class that year, with district-mean VCI values ranging from 2.7 in Jhalawar to 6.5 in Bundi. Extreme drought alone covered 80.5 percent of the area in Baran, 67.8 percent in Bundi, 85.1 percent in Jhalawar and 79.7 percent in Kota, and severe and extreme classes together covered roughly 91 percent of the region. Yet rainfall data from the India Meteorological Department did not fully explain this minimum. The rainfall deficit in 2010 was 40 percent in Baran and 37 percent in Jhalawar but only 14 percent in Kota and a mere 3 percent in Bundi. By contrast, in 2002 regional rainfall was about 57 percent below the long-term mean, yet the regional VCI of 21.3 never reached the extreme class. Across the full record, rainfall explained only about a quarter of the variance in regional VCI, and 2010 stood out as the largest negative residual, roughly 31 VCI points below what the rainfall-based expectation would suggest.
The researchers stress that their definition of drought is specific. Agricultural drought here means a below-normal vegetation condition on cropland relative to the 1997 to 2022 record, as measured by VCI, which is distinct from meteorological drought defined by rainfall shortfall. VCI scales each year’s NDVI against the minimum and maximum observed for the same pixel over the full 26-year period, so a value near zero indicates the worst vegetation condition in the record rather than an absolute measure of plant health. District drought classes were assigned from the mean annual VCI using the classification scheme of Kogan. Bundi had the lowest long-term mean VCI at 39.6 and was the only district whose average fell in the mild drought class, while Kota, Baran and Jhalawar fell in the no-drought class with means between 42.8 and 43.7.
Trend analysis revealed a sharp seasonal divide. Annual trends were tested with the Mann-Kendall test corrected for autocorrelation, with effect sizes estimated by Sen’s slope and p-values adjusted using the Benjamini-Hochberg method to account for multiple testing. Only Jhalawar showed significant annual trends in all three indices, with an NDVI slope of 0.0045 per year and a VCI slope of 1.693 points per year. However, when each index was regressed against rainfall of the corresponding period and the trend test was repeated on the residuals, the Jhalawar slopes fell to 0.0022 for NDVI, 0.0012 for NDWI and 0.847 for VCI and lost significance. Across all four districts, rainfall adjustment reduced the annual slopes by between 19 and 56 percent, and none remained significant. In other words, the apparent long-term greening in annual indices largely tracked wetter monsoon years rather than an independent shift in vegetation condition.
The seasonal picture told a different story. Rabi indices increased significantly in all four districts, with regional Sen’s slopes of 0.0060 per year for NDVI, 0.0046 per year for NDWI and 1.896 VCI points per year, all at p below 0.001. Kharif indices, by contrast, showed no trend in any district, with slightly negative regional slopes. This divergence is puzzling because rainfall moved in the opposite direction: Kharif rainfall increased significantly in Bundi and Kota and regionally, while Rabi rainfall showed no significant trend anywhere. Rabi rainfall in the dataset is small, with regional means below roughly 75 millimeters per year for most of the period, so winter rainfall cannot account for the rising Rabi vegetation. The authors point instead to canal irrigation from the Chambal system, tubewell irrigation, improved crop varieties, higher fertilizer use, mechanization and possible expansion of the area sown to Rabi crops as candidate explanations, though irrigated area, cropping intensity and crop area were not measured and could not be quantified.
The analysis also flagged a level shift in the satellite record around 2012 to 2013, coinciding with the arrival of Landsat 8. Pettitt change-point tests detected a step in the regional NDVI and VCI series after 2012, and at the district scale the step was significant only in Jhalawar. Within the two eras, the story differed: during 1999 to 2012 no index showed a significant increase in any district, and Bundi actually declined, while from 2013 to 2022 NDVI rose significantly in Baran and Kota and NDWI rose in Baran, Jhalawar and Kota. The authors note that a sensor offset alone cannot explain the shift, since the Kharif indices showed no corresponding jump, but they cannot rule out contributions from sensor harmonization residuals, a wetter monsoon after 2010, irrigation changes, or the rising number of valid satellite observations per pixel over the record, which grew from an annual mean of 14.0 in 1997 to 2007 to 35.8 in 2013 to 2022.
The crop yield analysis produced perhaps the most cautionary result. Barley, wheat and rapeseed yields correlated positively with Rabi indices, with barley reaching a correlation of 0.74 with VCI and wheat 0.65, while maize, rice and soybean showed weak negative correlations with Kharif indices. A 10-point increase in VCI corresponded to 0.22 tonnes per hectare higher barley yield and 0.28 tonnes per hectare higher wheat yield. But when both yield and index series were detrended by removing their regression on year, every correlation collapsed to between -0.13 and 0.13 and none was significant. The strong raw correlations arose because both Rabi yields and Rabi indices rose together over the study period, and two rising series correlate even when one does not drive the other. Leave-one-year-out cross-validation confirmed the point: a model using year alone outperformed any index for all six crops, and adding an index to year changed the cross-validated R-squared by between -0.07 and +0.03.
The authors draw four practical lessons for drought monitoring. First, monsoon drought should be tracked with Kharif composites, because annual composites can hide Kharif stress when the irrigated Rabi canopy is strong. Second, rising Rabi indices should not be read as reduced drought, since they partly reflect irrigation and management rather than rainfall. Third, the indices correlate with rainfall significantly only in Baran and Jhalawar, explaining at most a third of the variance, so they should be used alongside rainfall or the Standardized Precipitation Index rather than alone. Fourth, the indices added almost no predictive value for district yields beyond the time trend and should not be used alone for yield forecasting. The study also acknowledges limitations: the static 2021 cropland mask cannot capture land-use change, the 30-meter resolution misses sub-field variation, ground-based soil moisture records were unavailable, and the barley yield series behaves nearly like a single regional series because district values were identical across districts in most years. Future work, the authors suggest, should incorporate crop-specific masks, Sentinel-1 and Sentinel-2 data, soil moisture measurements and the Standardized Precipitation Evapotranspiration Index to sharpen drought and yield assessments in the region.
Subject of Research: Multi-index satellite assessment of agricultural drought dynamics and crop yield sensitivity in the Hadoti region of Rajasthan from 1997 to 2022
Article Title: Multi-index remote sensing assessment of drought dynamics and crop yield sensitivity in the Hadoti Region, Rajasthan
Article References: Meena, A. K., Pazhanivelan, S., Sathyamoorthy, N. K., Kokilavani, S., Ragunath, K. P., Vanitha, G., Meena, H., Banoth, S. K., Parapurath, F., & Babu, S. (2026). Multi-index remote sensing assessment of drought dynamics and crop yield sensitivity in the Hadoti Region, Rajasthan. Discover Plants, 3(1), Article 499. https://doi.org/10.1007/s44372-026-00992-4
Image Credits: AI Generated
DOI: 10.1007/s44372-026-00992-4
Keywords: drought, remote sensing, NDVI, NDWI, VCI, Rajasthan, Hadoti, Landsat, crop yield, Kharif, Rabi, agricultural drought
News Source: Alan Morgan. (October 27, 2026). Satellites Reveal Hidden Drought Patterns in India’s Hadoti Region. Scienmag.