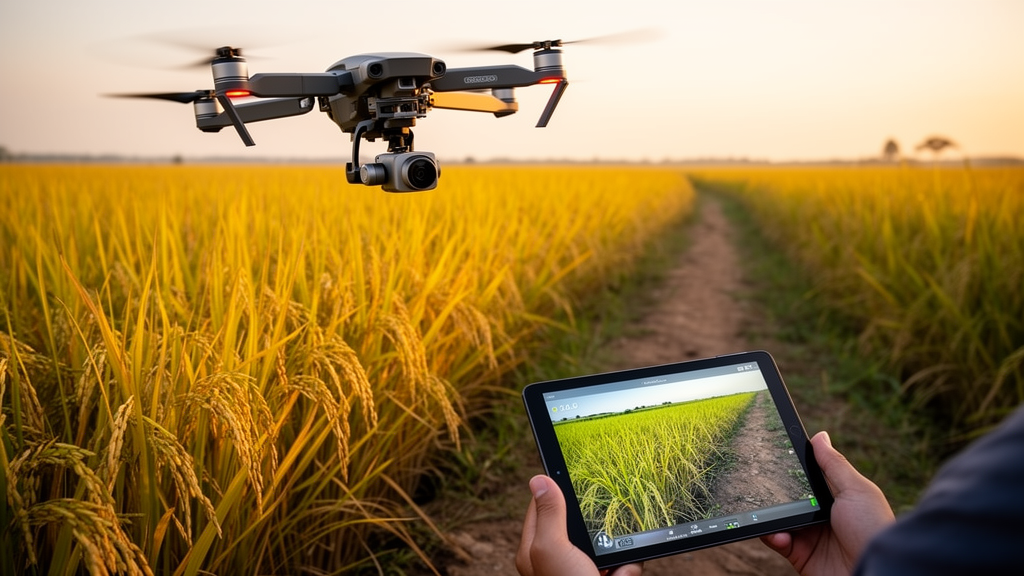
Rice feeds more than half the world’s population, yet yields have plateaued across many major production regions even as global demand keeps climbing. With little arable land left to expand into, breeders are under pressure to squeeze more grain from every hectare, and one of their most important tools is the ability to measure the plant traits that drive yield. A new study published in Smart Agricultural Technology reports a pipeline that measures rice panicles—the grain-bearing branches of the rice plant—from drone photographs taken at a slanted 45-degree angle, extracting panicle density, size, curvature, and distribution across entire breeding fields without touching a single plant.
The research, led by scientists at Texas A&M AgriLife Research and Extension Center in Beaumont, tackles a blind spot in existing drone-based phenotyping. Nearly all previous rice panicle detection work has relied on nadir-view images, captured straight down from above. From that angle, panicles appear foreshortened and their overlapping branches cannot be resolved, which makes reliable measurement of panicle size essentially impossible. Because panicle length, width, and area are closely tied to spikelet number and grain weight, they are prime targets in breeding programs—and traditional manual measurement of them is so labor-intensive that it severely limits how many genotypes, sites, and traits can realistically be assessed, slowing genetic gain.
The team flew a DJI Inspire 2 drone carrying a Zenmuse X7 camera with a 50 mm lens and 24-megapixel resolution at a height of 4.5 meters, with the camera tilted 45 degrees toward the ground. At that geometry, the average ground sampling distance was about 0.495 millimeters per pixel, and each original image of 6016 by 4008 pixels covered roughly 10 square meters of field—potentially containing several thousand panicles. The imaging campaigns ran from 2022 through 2024 over experimental fields planted with 40 rice genotypes differing in panicle type, size, tillering ability, and plant height, grown in a randomized complete block design with two replicates, plus a variety evaluation field with eight commercial varieties.
To make annotation tractable, each full image was divided into sixteen tiles, and the team annotated 1231 tile images, splitting them into 985 training, 124 validation, and 122 testing images. After further tiling and augmentation—horizontal flips, rotations between minus 15 and plus 15 degrees, and brightness adjustments—the final training dataset reached 12,800 images. The annotations captured panicles at three developmental stages: early-stage panicles, upright and compact at heading and flowering; mid-stage panicles bending less than 90 degrees during grain filling; and late-stage panicles drooping more than 90 degrees under grain weight. Full annotation of late-stage panicles proved possible only for a small subset of images—just 64 of the 1231 tiles—because dense canopies and spreading branches make them extremely hard to label.
The segmentation model itself is the study’s most unusual feature: a hybrid classical-quantum framework. A YOLO11-seg convolutional backbone performs initial feature extraction, while small 16-by-16-pixel patches around the boundaries of predicted panicle masks are encoded into quantum states using FRQI or NEQR representations and processed by a Quantum Convolutional Neural Network and a Quantum Support Vector Machine, all simulated on classical hardware through Qiskit’s AerSimulator. Coarse masks are then refined in three steps—Conditional Random Fields for spatial consistency, GrabCut for boundary sharpening, and quantum-inspired optimization via annealing and variational algorithms with COBYLA parameter tuning. The authors are explicit that these quantum stages run as classical simulations and claim no computational speedup; their argument is architectural, resting on norm-preserving unitary operations, a high-dimensional kernel structure, and nonlinear intensity encoding that differ from comparable classical layers.
On the test set, the full framework reached a mean IoU of 0.82, precision of 0.87, recall of 0.83, F1-score of 0.85, mAP@0.5 of 0.88, and mAP@0.5:0.95 of 0.62, outperforming retrained baselines including YOLO11-Seg, RF-DETR, and SAM2. A cumulative ablation showed where the gains came from: starting from a YOLO11l-seg baseline with mAP@0.5:0.95 of 0.51, classical post-processing with CRF and GrabCut added 3 percentage points, the quantum-inspired feature extraction stage added another 4, and the quantum mask refinement stage added a final 4, bringing the total to 0.62. The quantum-inspired stages therefore accounted for roughly 73 percent of the improvement, with recall rising from 0.74 to 0.83. Stage-specific results held up across early, mid, and late panicle stages, though the authors caution that late-stage performance rests on a small training set.
The accuracy comes at a real computational price. The complete pipeline processes one full-resolution image in 6.3 seconds—a throughput of 9.5 images per minute—roughly twice the per-image cost of the YOLO11l-seg backbone alone, and it requires 26.1 GB of peak GPU memory compared with 8.2 GB for the backbone, driven mainly by inference batch size and intermediate feature maps rather than the quantum simulation, which is negligible in the memory budget. Training took 18.5 hours on an A100 GPU. The authors note this latency is modest for offline phenotyping of stored imagery, while the memory footprint is the principal practical constraint, though it remains within the capacity of current data-center GPUs.
Applied to full-resolution images from seven flight dates in 2024, with SAHI slicing inference and perspective correction based on a reference panel photographed at the same drone distance, the pipeline produced trait distributions that behaved as agronomy would predict. Average panicle densities rose from 88.8 panicles per square meter at the early stage to 157.0 at mid-stage and 212.0 at late stage, while average panicle sizes grew from 8.9 to 12.6 to 16.0 square centimeters. Curvature increased for late-stage panicles, corresponding to tighter bending, and the proportion of plot area covered by panicles climbed from 0.09 to 0.22 to 0.37. Across 40 genotypes, the model tracked panicle density peaks at different days after planting—L202 peaking earliest at 109 days, 153R latest at 130 days—and detected significant differences among genotypes in density, area, and curvature at most sampling dates.
The one ground-truth validation revealed an honest limitation. Manually measured panicle lengths from 1232 panicles in 25 plots averaged 15.1 centimeters, while the model’s estimates from images taken within an hour averaged 14.1 centimeters, with a correlation R² of 0.64 and a mean bias of 1.73 centimeters. The underestimate is systematic: a single ground-plane perspective transform cannot recover the component of panicle length extending above that plane, and occlusion by leaves can split one panicle into shorter segments. Because the bias is near-constant rather than random, the authors note that trait comparisons remain valid on a relative basis, and they suggest depth-model-based 3D reconstruction as a route to absolute accuracy. They also flag that model performance is strongest during the one-to-two-week heading-flowering window, that very high-tillering genotypes with dense small panicles may defy individual counting, and that panicles hidden below the canopy remain difficult to detect after grain filling.
For breeders, the practical takeaway is a tool that can sweep entire fields twice a week during flowering and return density, size, and curvature estimates for dozens of genotypes at once, replacing ruler-and-clipboard measurement that has constrained phenotyping for decades. The study also adds a data point to a live debate about quantum-inspired machine learning: here, simulated quantum components delivered measurable accuracy gains over a strong classical baseline, but only at roughly double the inference latency and triple the memory cost, with no hardware speedup claimed. Whether such components earn their place in operational breeding pipelines will depend on whether the accuracy premium justifies the overhead at scale—and on future work extending the approach to true 3D reconstruction of the panicle architecture that ultimately determines yield.
Subject of Research: Vision-based high-throughput phenotyping of rice panicles using oblique UAV imagery and a hybrid classical-quantum segmentation framework
Article Title: Vision-based rice panicle phenotyping from oblique UAV imagery
Article References: Huynh, T. N., Yang, Y., Zhang, J., Samonte, S. O. P., Dou, F., Sanchez, D., Bera, T., Li, S., Wilson, L. T., Wang, J., Jyoti, S. D., Talukder, S., & Nguyen, K.-D. (2026). Vision-based rice panicle phenotyping from oblique UAV imagery. Smart Agricultural Technology, 15, Article 102664. https://doi.org/10.1016/j.atech.2026.102664
Image Credits: AI Generated
DOI: 10.1016/j.atech.2026.102664
Keywords: rice phenotyping, UAV imaging, oblique imagery, panicle segmentation, deep learning, quantum-inspired computing, YOLO11, high-throughput phenotyping, crop breeding, perspective correction, machine vision, agricultural technology
News Source: Alan Morgan. (October 28, 2026). Research report: Vision-based rice panicle phenotyping from oblique UAV imagery. Scienmag.