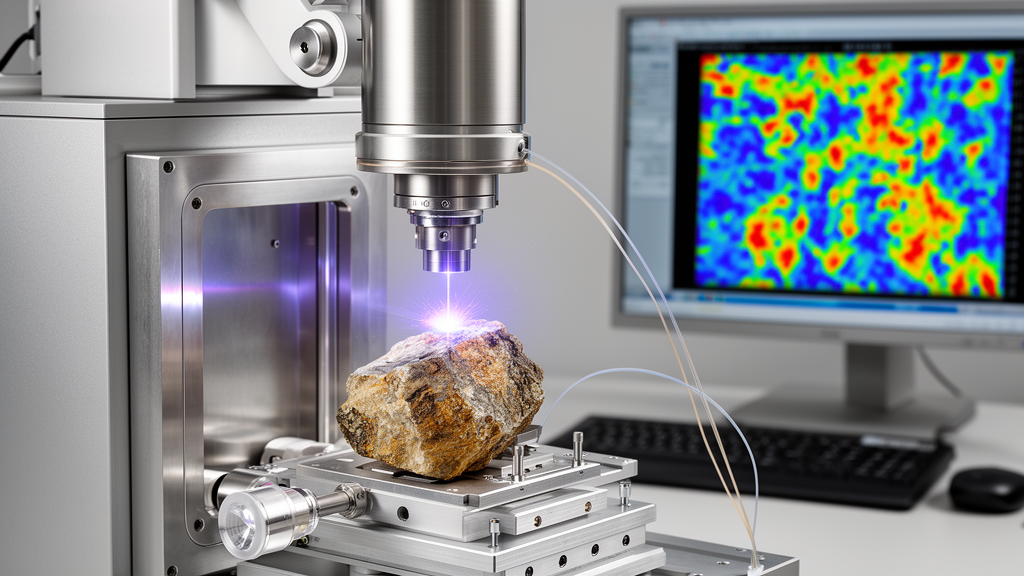
Spectroscopic imaging of solid materials has expanded rapidly, yet extracting nuanced physical insights from vast spectroscopic datasets often lags behind instrumentation. In a paper published in SoftwareX, researchers Marie-Chloé Michaud Paradis, Charles Chénier, Hasan Omar Abbas, François R. Doucet, Lütfü Ç. Özcan, and Mickaël Dollé introduced pylibs-stats, an open-source Python library designed for statistical processing of laser-induced breakdown spectroscopy imaging. Laser-induced breakdown spectroscopy, or LIBS, produces spatially resolved hyperspectral datasets containing thousands of spectra per second, with full emission spectra acquired at every pixel coordinate. For heterogeneous solid-state samples where conventional elemental quantification is difficult, the primary technical challenge has shifted from collecting raw datasets to extracting interpretable chemical and structural information. Operating downstream from raw spectral acquisition, pylibs-stats analyzes the spatial distribution of extracted spectral features across an image rather than relying solely on mean intensities. This design treats pixel-level statistical dispersion as an analytical signal instead of discarding spatial variance as noise.
Existing software tools in the scientific community have generally treated hyperspectral imaging cubes as tabular collections of individual spectra. Among openly available software, the Python Hyperspectral Analysis Tool, known as PyHAT, represents the most comprehensive existing framework for LIBS data. PyHAT provides spectral preprocessing routines such as baseline correction, normalization, and outlier removal, alongside dimensionality reduction, clustering, and cross-validated multivariate regression accessible via a graphical user interface and Python API. Other common chemometric methodologies, such as principal component analysis, spectral unmixing, and partial least squares regression, have circulated predominantly as methodological concepts rather than packaged software implementations. By contrast, pylibs-stats positions itself downstream from these platforms by adopting the spatial distribution of extracted features across an entire image as its fundamental unit of analysis. The two software approaches remain complementary: spectra preprocessed or modelled using external platforms integrate directly into distribution-based workflows, and pylibs-stats does not attempt to reproduce general preprocessing or multivariate chemometrics.
Analyzing laser-induced breakdown spectroscopy signals through their complete distributions rather than mean values reflects the physical nature of laser ablation plasmas. Prior research demonstrated that LIBS signal statistics are inherently non-Gaussian and carry physical information regarding sample composition and microstructure at the level of individual laser pulses. Previous studies have used single distribution descriptors in isolation to recover physical properties, such as using the Gini index of ChemCam signal distributions on Mars to constrain rock grain sizes, or deploying higher-order line-shape statistics to classify geological samples. However, these earlier efforts applied individual descriptors separately to specific spectral lines using specialized, study-specific code. The developers of pylibs-stats recognized that the field lacked an integrated framework where a standardized suite of distribution descriptors could be computed identically for any user-defined feature, screened systematically against external chemical properties, applied back onto individual images, and characterized using spatial resampling with parallel scalability for millions of spectra.
To implement this approach, pylibs-stats extracts custom mathematical features from raw hyperspectral acquisitions and computes detailed one-dimensional and two-dimensional statistical distributions. Users define named features as expressions over emission peaks cataloged in a project peak table, supporting single peaks, spectral ratios, nested normalizations of the form x/(x+y), and nonlinear transformations. When a feature’s outermost mathematical operation is division, the library designates it as a ratio feature and additionally computes the joint distribution of its numerator and denominator. Per-sample pipeline execution evaluates every feature into per-pixel values, calculates sample-wide spectra, and generates distribution histograms. The software derives both parametric and non-parametric descriptors, including the Gini index to measure concentration from zero to one, Shannon entropy to quantify distributional disorder, and the closed-form Kullback–Leibler divergence between a fitted Gaussian distribution and the standard normal distribution. For ratio features, joint histograms provide bivariate metrics, including Pearson correlation coefficients and joint divergences that quantify inter-signal relationships.
The software architecture centers on a single programmatic core that guarantees identical behavior across three distinct user interfaces. Users can interact with pylibs-stats through a command-line interface, a lightweight domain-specific language, or a Python API, all of which access core functionality through a single facade module named core.api. Because the interfaces never access internal computational layers directly, they remain thin and cannot drift out of sync. When developers implement a new statistical metric, regression algorithm, or processing operation, they register it once in the core engine and expose it via the facade, making it immediately available across all interfaces. Beneath this facade, the architecture is partitioned into structured layers: a configuration layer that establishes data models using Pydantic, an input-output layer for file operations and persistence, a feature layer for expression evaluation, a pipeline layer that computes sample and cross-sample statistics, and a reporting layer that exports processed outputs into publication-quality figures, PDF summaries, and CSV tables.
Data persistence and format handling in pylibs-stats are structured around project directories and the open .libs data format. A project directory acts as an organizing unit holding a sample registry, a peak table, registered feature expressions, a results store, and an operational log. The software reads acquisitions saved in the .libs format, an uncompressed NumPy archive containing spectral arrays in serpentine scan order, a calibrated wavelength axis, and acquisition parameters stored as JSON. Because archive members remain uncompressed on disk, spectral data are memory-mapped via NumPy, allowing extraction pipelines to stream data without loading multi-gigabyte files entirely into RAM. Computed results stream into a chunked on-disk Zarr version 3 store, partitioned into distinct groups for each registered sample alongside project-wide analytical groups. This chunked persistence architecture ensures that large processing jobs can be interrupted, resumed, extended, or partitioned across multiple computing nodes without repeating prior calculations or corrupting partially completed results stores.
To govern incremental recomputation reliably, pylibs-stats identifies data states using content-derived cryptographic hashes rather than filesystem timestamps or software versions. Each registered feature is assigned a 128-bit BLAKE2b hash calculated directly from its mathematical expression and all associated peak-table parameters, including elemental labels, peak wavelengths, and tolerance windows. If a researcher corrects a peak wavelength, the associated hash changes automatically, even though the text of the feature expression remains identical. Before executing any pipeline stage, the software compares stored input hashes against current configurations to determine whether recomputation is required. The recomputation scope is tailored to each stage: a mismatch in the feature extraction stage recomputes all features in one streaming pass, whereas one-dimensional and two-dimensional distribution statistics recompute only the specific modified features. Resampling configurations track execution progress using boolean completion arrays linked to random seeds, while raw spectroscopic files are treated as immutable measurement records that the library never modifies.
Cross-sample analysis links stored distribution metrics against external scalar properties, such as independently measured elemental compositions. The software applies univariate least-squares regression to fit distribution descriptors against target properties, evaluating twelve metrics for single-peak features and seventeen metrics for ratio features. An automated correlation screening routine compiles these fits into ranked matrices reporting Pearson correlation coefficients, coefficients of determination, mean absolute errors, and permutation test p-values. The permutation test evaluates statistical significance by randomly shuffling property values across samples over ten thousand iterations, calculating empirical p-values based on whether permuted errors match or fall below unpermuted errors. When multiple acquisitions share a sample name, such as successive ablation passes on one pellet, pylibs-stats groups them into a single inference unit by default to respect statistical dependence. The system computes ninety-five percent confidence intervals using Student’s t-distribution weighted by replicate counts, displaying replicate variance as error bars around a unified calibration point.
Fitted regression models can be applied back onto individual sample acquisitions, converting per-pixel feature values into predicted property maps and distribution statistics. To prevent unwarranted extrapolation across heterogeneous materials, predictions falling within the calibration range appear on a continuous color scale, whereas extrapolated pixels exceeding calibration bounds are rendered black in both spatial maps and distributions. This diagnostic visualization highlights where bulk-averaged linear calibrations fail to represent local material composition. In parallel, the library supports spatial bootstrap resampling using random pixel selection or contiguous square blocks, with optional coordinate shuffling to separate genuine spatial heterogeneity from estimator artifacts. Parallel execution handles these workloads via an in-process worker pool or independent static-share processes. In benchmark tests on a 16-core workstation, batch processing reached speedups of 2.01 with worker pools and 2.79 with independent processes, while bootstrap resampling reached 2.55 and 3.10. Worker pool startup imposed roughly 0.6 seconds of fixed overhead due to scientific library imports under Python’s spawn method.
The researchers verified the workflow using a bundled example dataset archived on Zenodo under DOI 10.5281/zenodo.22313353, comprising seven graphite pellets containing calcium hexaboride additions. Each pellet was analyzed across three successive ablation layers, yielding twenty-one acquisitions of 861 spectra. Evaluating sixteen features across calcium, boron, and matrix emission lines, correlation screening demonstrated that mean intensities of Ca393 and B249 both correlated identically with calcium content at r = 0.922, reflecting co-varying analytes and highlighting how screening exposes spectral ambiguity. The authors noted several release limitations: regression is currently restricted to univariate linear models, feature extraction relies on peak heights with local continuum subtraction without baseline deconvolution, and screening permutation p-values omit multiplicity adjustments. Additionally, histogram metrics depend on sample binning, and Kullback–Leibler divergence is scale-dependent. Released under the BSD 3-Clause license, the software was developed with Claude Code assistance, reviewed and validated by the authors, with registries structured to support future multivariate calibration and advanced spatial descriptors.
Subject of Research: Open-source Python library for distribution-based statistical analysis of laser-induced breakdown spectroscopy imaging
Article Title: pylibs-stats: a Python library for statistical processing of laser-induced breakdown spectroscopy images
Article References: Michaud Paradis, M.-C., Chénier, C., Abbas, H. O., Doucet, F. R., Özcan, L. Ç., & Dollé, M. (2026). pylibs-stats: a Python library for statistical processing of laser-induced breakdown spectroscopy images. SoftwareX, 36, Article 103208. https://doi.org/10.1016/j.softx.2026.103208
Image Credits: AI Generated
DOI: 10.1016/j.softx.2026.103208
Keywords: laser-induced breakdown spectroscopy, LIBS imaging, pylibs-stats, Python, hyperspectral imaging, distribution statistics, Gini index, Shannon entropy, Kullback-Leibler divergence, Zarr storage, parallel processing, chemical imaging, spectroscopic analysis, permutation testing, spatial heterogeneity, calcium hexaboride, open-source software, chemometrics
News Source: Scienmag.