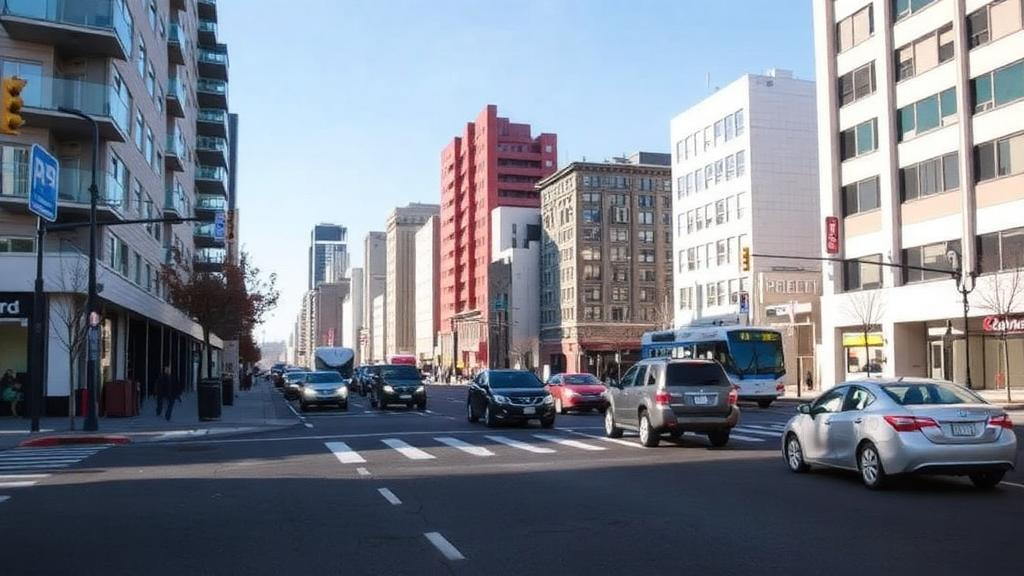
Cities come in every conceivable shape. Some sprawl across a hundred kilometers of coastal plain, others cluster tightly around a single downtown core, and still others form polycentric constellations of job centers stitched together by highways. According to a study published in Nature Cities, however, when it comes to the hidden structure of human movement, most American metropolitan areas are astonishingly alike. A team led by Weiyu Li, with colleagues including Yilong Han, Michael Batty, Jianxi Gao and Qi R. Wang, has distilled the spatial coherence of urban mobility into a single number, and that number turns out to be nearly identical across twelve very different US metropolitan areas.
The new quantity is called the spatial range exponent, written ρ, and it captures something that traditional mobility models have consistently missed. For decades, researchers have described travel between places using pairwise origin-destination flows, the bread-and-butter of gravity models that trace back to John Q. Stewart and George Zipf in the 1940s. Those models assume that the number of trips between two locations grows with their populations or attractions and shrinks with the distance between them, a logic descended from Waldo Tobler’s famous first law of geography: near things are more related than distant things. But pairwise flows say nothing about how movements stack up across an entire city to produce system-wide spatial order.
Li and her colleagues approached the problem differently. Instead of treating each trip as an isolated link, they examined how mobility patterns are correlated across pairs of neighborhoods separated by increasing distances. Drawing on Census Block Group-level mobility flows derived from anonymized location data provided by SafeGraph, the researchers computed correlations among the movement profiles of neighborhoods and tracked how those correlations decay as the separation between areas grows. The decay follows an exponential form, and the rate of that decay is the spatial range exponent. A large ρ means spatial coherence collapses quickly with distance, so each neighborhood’s mobility rhythm is a local affair; a small ρ means movement patterns remain synchronized across far-flung parts of the metropolis.
The striking result is how narrow the distribution of ρ turns out to be. Across twelve US metropolitan areas with substantially different histories, geographies and urban forms, the exponent concentrated at 0.42 with a standard error of only about 0.015. In other words, despite enormous differences in physical layout, density and economy, the exponential reach of mobility correlations is essentially conserved. That kind of tight clustering evokes earlier discoveries of urban universality, from Luis Bettencourt and Geoffrey West’s scaling laws for city metabolism to Marc Schläpfer’s universal visitation law of human mobility. It suggests that when millions of individuals make independent daily decisions about where to go, the aggregate pattern obeys a deep regularity that individual urban form only weakly constrains.
The finding becomes even more interesting when tested against a null model. The team built population-distance null models that shuffle or predict mobility using only how many people live in each neighborhood and how far apart neighborhoods are. Those null models systematically underestimated the observed ρ. The implication is that real cities contain higher-order spatial organization beyond what pairwise distance decay can explain. Correlations among mobility patterns are not simply the residue of distance and population; they reflect coordinated structure, perhaps the shared gravity of employment centers, transportation corridors and the rhythm of daily schedules that synchronize entire districts. The spatial range exponent is, in this sense, a diagnostic of genuine collective organization, not just an artifact of geography.
Because ρ summarizes citywide spatial coherence in a single parameter, it offers something rare: a common yardstick for comparing cities and for measuring how a city reorganizes when struck by crisis. The researchers tested this by tracking the exponent through disruptive events, including natural disasters and the COVID-19 pandemic. In each case, ρ declined by one to three percent, a small percentage change but one that exceeded the routine variability observed in ordinary times. The decline means that the spatial reach of mobility correlations contracted: neighborhoods became less coordinated with progressively distant areas, and the effective spatial coherence of the metropolis shrank inward.
That contraction makes intuitive sense once the mechanics are spelled out. During a hurricane evacuation or a pandemic lockdown, people stop making long, cross-city trips and retreat to nearby destinations, whether the closest supermarket, the neighborhood clinic or the home itself. Long-range movements are precisely the ties that bind distant neighborhoods into a single correlated system, so when they are suppressed first, the correlation horizon shortens. Earlier work by Li, Wang and Gao had shown that human mobility decays in characteristic spatiotemporal ways during large-scale crises; the new exponent generalizes that insight into a system-level index. Where previous studies described changes in specific flows or in the diversity of encounters, ρ measures the reorganization of the mobility fabric as a whole.
The public-health implications may be the most consequential. Epidemic models depend critically on how people mix across space, because a pathogen spreads along the same corridors that commuters and shoppers trace every day. If the spatial range exponent quantifies how far mobility coherence extends, then shifts in ρ should shape how far and how fast outbreaks propagate. During the pandemic, the observed drop in ρ coincided with the wholesale restructuring of travel that preceded and accompanied changes in case trajectories, and the team connects the exponent to epidemic dynamics in their analysis. A compact, routinely computable indicator of mixing reach could therefore give epidemiologists and policymakers a faster read on how effectively a city’s internal connectivity has been reduced, complementing case counts and reproduction numbers that lag behind behavior.
The study’s data infrastructure reflects a decade of maturation in mobility science. Alongside the SafeGraph-derived US flows, the researchers drew on population figures from the US Census Bureau’s American Community Survey, geospatial boundaries from TIGER/Line shapefiles and COVID-19 case counts from the Johns Hopkins Coronavirus Resource Center. Validation analyses extended to four Japanese metropolitan areas using a large longitudinal trajectory dataset published on Zenodo. Crucially, both the processed datasets and the analysis code, written in R, are publicly available on GitHub, allowing other researchers to compute ρ for their own regions. The work also benefited from support including grants from the US National Science Foundation and the National Natural Science Foundation of China.
What the spatial range exponent ultimately offers is a vocabulary shift. Rather than cataloging thousands of origin-destination pairs or decomposing cities into ever finer flow matrices, urban scientists can now ask a single sharp question: how far does the coherence of movement reach? The answer, remarkably stable at 0.42 for American metropolises in ordinary times, provides a baseline against which fragility becomes visible. When ρ slips, a city’s internal connectivity is genuinely contracting, whether under floodwaters, stay-at-home orders or gradual structural change. As urban populations grow and climate-driven disruptions multiply, that kind of early, quantitative signal, readable from the same anonymized mobility data that cities already collect, could prove indispensable for anticipating congestion cascades, calibrating epidemic response and designing cities whose spatial coherence is resilient by design.
Subject of Research: The spatial range exponent as a system-level measure of human mobility correlations and disruption response in urban systems
Article Title: The spatial reach of mobility interactions in urban systems
Article References: The spatial reach of mobility interactions in urban systems. (n.d.). https://doi.org/10.1038/s44284-026-00531-y
Image Credits: AI Generated
DOI: 10.1038/s44284-026-00531-y
Keywords: urban mobility, spatial range exponent, cities, complex networks, COVID-19, natural disasters, epidemic modeling, origin-destination flows, spatial correlation, Nature Cities, SafeGraph, urban systems
News Source: Denise Maddox. (October 12, 2026). One Number Reveals How Far Mobility Waves Travel Through a City. Scienmag.