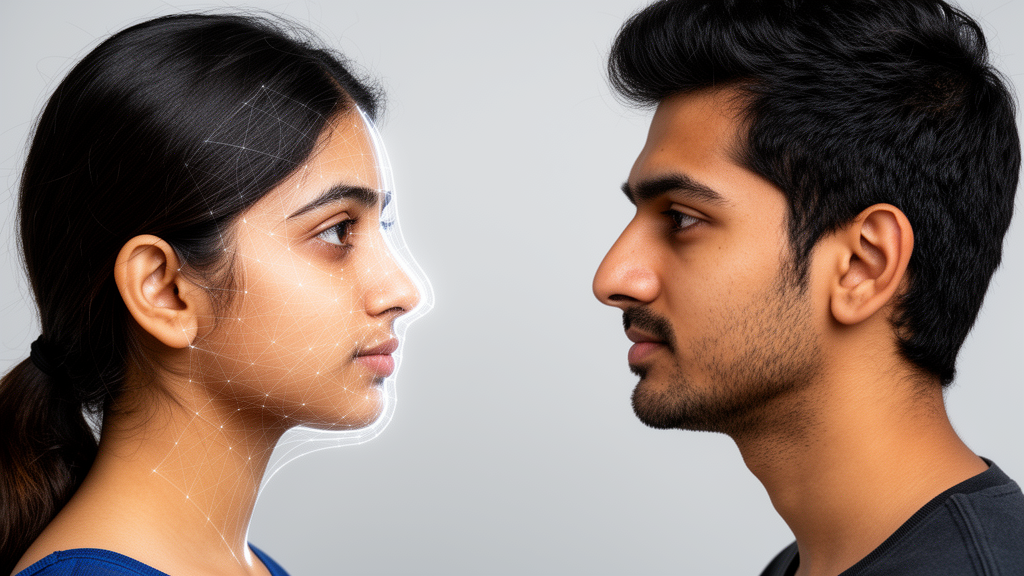
The human nose, long valued by forensic anthropologists as a window into ancestry and identity, has now been put through a machine learning test in North India — and the results show that its shape carries measurable, if imperfect, clues about both a person’s sex and their ethnic community. In a study published in the Egyptian Journal of Forensic Sciences, researchers photographed the noses of 500 adults from two genetically distinct endogamous groups in the district of Mandi, Himachal Pradesh, and trained three classification algorithms to predict sex and ethnicity from eighteen qualitative morphoscopic traits. The models performed better at distinguishing between the two communities than between males and females, with the best ethnicity accuracy reaching 75 percent and the best sex accuracy 69 percent on a held-out test set.
The participants, aged 18 to 35 years, comprised 255 males and 245 females, drawn from 257 Rajputs and 243 Brahmins. These two groups were chosen because India’s population is structured into endogamous caste communities rather than forming a single panmictic population, and prior genetic research has found that differences among Indian population groups exceed those seen in Europe, a pattern attributed to millennia of caste-enforced endogamy, genetic drift and population fragmentation. The study’s authors note that the morphological contrasts between such groups are best understood not as racial categories but as the biological signatures of long-term reproductive isolation operating within a socially stratified system. Only healthy individuals with no history of nasal trauma, fracture, deformity or congenital craniofacial anomalies were enrolled, and each participant gave written, signed consent under ethical clearance from the Panjab University Institutional Ethical Committee.
Image capture followed a standardized protocol. Using a digital camera mounted on a tripod, the team photographed each nose from frontal, basal and lateral profiles, with the camera set at a distance of 35 centimetres for the lateral and frontal views and 12 centimetres for the basal view. Subjects held their faces in the Frankfurt Horizontal plane and maintained a neutral expression with lips in repose and eyes looking straight ahead. Data collection took place in designated rooms within colleges, and while lighting conditions were not strictly controlled because instruments were transported between sites, the researchers made efforts to ensure adequate and consistent illumination. The observer who scored the morphological traits was blinded to the sex and ethnicity of the participants to minimize observational bias.
The eighteen morphoscopic parameters included nose size, nasal bridge profile, nasal root height above the inner angle of the eye, nasal root depth from nasion, nasal root breadth and shape, profile of the nose tip, nasal wings or alae, nasal septum size, breadth, direction and visibility, and nasal cavity shape. Classification followed standard procedures, and the resulting categorical data were fed into three machine learning models: a Random Forest classifier, CatBoost and a Support Vector Machine. The dataset was divided with a stratified 80:20 train-test split, allocating 400 observations to model development and hyperparameter tuning through grid search, and 100 observations to an independent held-out test set that was never used for hyperparameter selection. A stratified fivefold cross-validation with shuffling and a fixed random seed was applied within the training data to assess performance stability.
For sex classification, the Support Vector Machine achieved the highest accuracy at 69 percent, followed by Random Forest at 68 percent and CatBoost at 62 percent. These test-set figures correspond to approximate 95 percent confidence intervals of 59.4 to 77.2 percent, 58.3 to 76.3 percent and 52.2 to 70.9 percent respectively, reflecting substantial sampling uncertainty on a 100-person test set. Confusion matrices showed the SVM correctly classified 35 males and 34 females while misclassifying 16 males and 15 females, and Random Forest performed similarly, whereas CatBoost misclassified 19 males and 19 females. In fivefold cross-validation, Random Forest actually achieved the highest mean accuracy at 64.50 percent, followed closely by CatBoost at 64.25 percent and SVM at 62.50 percent, with fold-wise accuracies ranging from roughly 56 to 72 percent.
Ethnicity classification proved somewhat more successful. Random Forest reached 75 percent accuracy, CatBoost 72 percent and SVM 70 percent, with confidence intervals of 65.7 to 82.5 percent, 62.5 to 79.9 percent and 60.4 to 78.1 percent respectively. A consistent pattern emerged across all three models: Brahmin individuals were identified more reliably than Rajputs, with recall of 0.88 for Brahmins versus 0.63 for Rajputs in the Random Forest model, and similar trends in the other two algorithms. In the confusion matrices, all three models correctly identified 32 Rajput individuals while misclassifying 19 as Brahmins, but Random Forest correctly classified 43 Brahmins with only 6 misclassified, compared with 40 for CatBoost and 38 for SVM. Cross-validated mean accuracies for ethnicity ranged from 64.25 to 66.25 percent across the models.
Receiver operating characteristic analysis reinforced the same contrast. For sex estimation, the Random Forest model achieved the highest area under the curve at 0.705, followed by SVM at 0.702 and CatBoost at 0.675. For ethnicity, all three models showed higher AUCs — 0.793 for Random Forest, 0.778 for SVM and 0.738 for CatBoost — indicating that nasal morphology is more discriminative for ethnic classification than for sex estimation in this sample. The authors emphasize that the differences in accuracy and AUC among the evaluated models were not statistically significant, so the numerical rankings should be read as variations in performance rather than evidence that one algorithm meaningfully outperformed another.
Interpretability analysis using SHAP, or SHapley Additive exPlanations, revealed which traits drove the predictions. For sex classification, nose size and nasal root height above the inner angle of the eye consistently ranked among the top predictors across all three models, suggesting a robust, model-independent signal of sexual dimorphism. For ethnicity, by contrast, the feature hierarchies diverged sharply: Random Forest ranked nose size, nasal septum size and nasal root height highest, SVM prioritized nasal septum profile, nasal root depth from glabella and nasal bridge profile, and CatBoost favoured nasal root height, nasal root shape and nose size. The authors interpret this inconsistency as evidence that no single nasal trait dominates ethnicity classification uniformly, and that different algorithms may be capturing distinct, complementary aspects of population-level morphological variation.
Reliability checks supported the scoring system, though with one notable caveat. Intra-observer agreement, assessed with Cohen’s kappa on 50 individuals re-examined one month later, ranged from 0.414 to 1.000, with most features showing kappa values of at least 0.60 and all p values statistically significant. The lowest agreement was for nose size, which the authors attribute to the inherently subjective nature of visually categorizing a continuous, relative trait lacking a sharp categorical boundary; they recommend standardized photogrammetric measurements for nose size in future work. They also acknowledge that all trait scoring was performed by a single observer, so inter-observer reliability could not be assessed, and that the sample skewed toward younger, more educated, urban and semi-urban participants.
The study’s authors are careful to frame the findings appropriately. The classification accuracies of 62 to 75 percent fall far short of what is needed to identify individual people through methods such as DNA or fingerprint analysis, and the results should be interpreted as statistical associations between nasal morphoscopic characteristics and sex or ethnicity at the population level, not as a means of personal identification. Nasal morphoscopic analysis should not be regarded as a standalone forensic method, but rather as a corroborative tool used alongside established identification techniques. The sample was also limited to one regional population, two endogamous groups and a narrow age range, and no external validation was performed. Still, the researchers argue that the work demonstrates the feasibility of combining qualitative morphoscopic analysis with machine learning as an objective, cost-effective approach for forensic facial identification, and they call for larger, more diverse samples, additional morphological and anthropometric parameters, and more sophisticated deep learning techniques in future research.
Subject of Research: Machine learning classification of sex and ethnicity from nasal morphoscopic traits in two North Indian endogamous populations
Article Title: Machine learning-based comparative analysis of nasal morphology: Forensic implications for sexual dimorphism and ethnic variation
Article References: Kaur, T., Siwan, D., Guleria, A., Meena, R., Chitara, N., Rana, A., Srivastava, A., & Krishan, K. (2026). Machine learning-based comparative analysis of nasal morphology: Forensic implications for sexual dimorphism and ethnic variation. Egyptian Journal of Forensic Sciences, 16(1), Article 86. https://doi.org/10.1186/s41935-026-00589-8
Image Credits: AI Generated
DOI: 10.1186/s41935-026-00589-8
Keywords: forensic anthropology, nasal morphology, machine learning, sexual dimorphism, ethnic variation, SHAP, Random Forest, Support Vector Machine, CatBoost, North India, morphoscopic traits, biological profile
News Source: Teresa Odom. (October 28, 2026). Nose shape predicts sex and ethnicity in North Indian populations, machine learning study finds. Scienmag.