Early in the pandemic, it was expected that satellite imagery around the world would show cleaner air as a result of COVID-19 lockdowns. But not all pollutants were taken out of circulation. For tiny airborne-particle pollution, known as PM 2.5, researchers using NASA data found that variability from meteorology obscured the lockdown signals when observed from space.
“Intuitively you would think if there is a major lockdown situation, that we would see dramatic changes, but we didn’t,” said Melanie Hammer, a visiting research associate at Washington University in St. Louis who led the study. “It was kind of a surprise that the effects on PM 2.5 were modest.”
PM 2.5 describes the mass of nose-level particles, often produced anthropogenically, that are smaller than 2.5 micrometers, or roughly 30 times smaller than the width of a human hair. PM 2.5 is small enough to linger in the atmosphere, and, when inhaled, is associated with increased risk of heart attack, cancer and a host of other implications for human health.
By combining NASA spacecraft data with ground-based monitoring and an innovative computer modeling system, the scientists mapped PM 2.5 levels across China, Europe and North America during the early months of the pandemic. The researchers found seasonal differences in PM 2.5 between recent years were driven primarily by the natural variability of the meteorology, not by pandemic lockdowns.
Published June 23 in the journal Science Advances, the new research integrates data from NASA’s Terra and Aqua satellites, as well as meteorological modeling input from the NASA Global Modeling and Assimilation Office.
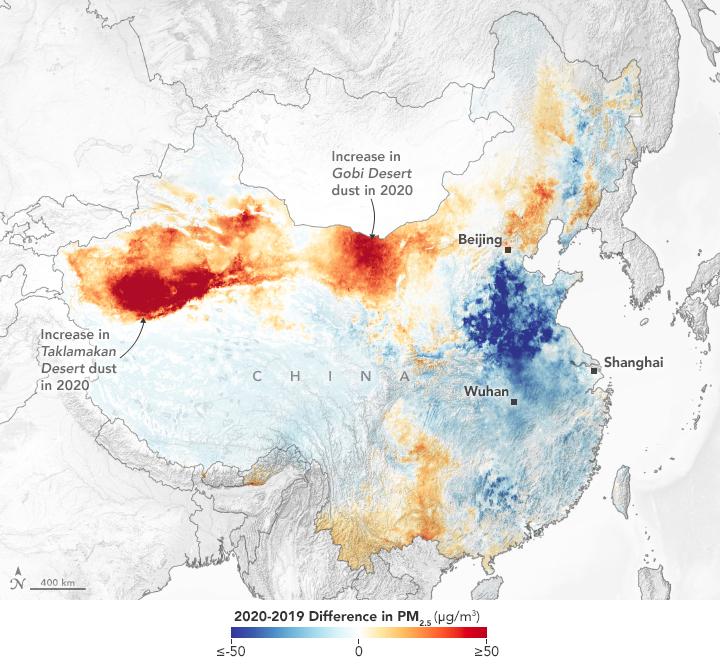
The meteorological effects analyzed in the study include changes in the sources of mineral dust, the way pollutants react to sunlight in the atmosphere, mixing and heat transfer, as well as the removal of pollutants from the atmosphere by precipitation.
PM 2.5 is among the most complicated pollutants to study because its particle size, composition and toxicity vary greatly depending on its source and environmental conditions.
A gas pollutant known as nitrogen dioxide, or NO2, did see dramatic declines during the lockdowns. A major byproduct of fuel burning by trucks, cars and other vehicles, the decline of nitrogen dioxide was visible from space and from the ground. Images of clear, blue skies where heavy smog had been the norm flooded popular news and social media, suggesting COVID-19 has drastically decreased all pollution in general.
When nitrogen dioxide is emitted, it can also interact with other chemicals in the atmosphere and form PM 2.5. However, the two pollutants do not have a linear relationship. Half as much nitrogen dioxide in the atmosphere does not necessarily lead to half as much PM 2.5 produced by nitrogen dioxide.
Because PM 2.5 often comes from the same sources as NO2, the researchers also began to question whether the lockdowns resulted in a decline of PM 2.5.
Early pandemic studies of PM 2.5 changes analyzed data from ground monitoring sites, which test the surrounding air. But because those ground sites are few and far between, their data alone are unable to piece together the bigger picture of PM 2.5 concentrations in the air, Hammer said.
“We were most interested in looking at changes in PM 2.5 because PM 2.5 is the leading environmental risk factor for premature mortality globally,” Hammer said. “We decided to look again, using a more complete picture from satellite images.”
The study was co-led by Randall Martin at Washington University in St. Louis, who pioneered research integrating modeling and remote sensing to study atmospheric pollutants such as PM 2.5.
“Many countries in the world have no operational PM 2.5 monitoring at all,” Martin said. “These tools enable insight into ground level PM 2.5 at the global or regional scale.”
To ensure a comprehensive analysis, the team focused on regions with extensive ground monitoring systems in place and compared monthly estimates of PM 2.5 from January to April in 2018, 2019 and 2020.
When the researchers compared PM 2.5 levels over the three years during the months that coincided with each region’s lockdown phases, there weren’t many clear signals over North America or Europe. The most significant lockdown-related differences were detected in China.
“We found the most clearly detectable signal was a significant reduction over the North China Plain, where the strictest lockdowns were concentrated,” Hammer said.
To figure out whether the lockdown was responsible for that signal, and several smaller ones dotted around the areas surveyed, the team ran different “sensitivity simulations” using GEOS-Chem, a chemical transport model to which Martin’s team helps lead.
They simulated a scenario where anthropogenic emissions of nitrogen dioxide were held constant and meteorological variability was solely responsible for year over year differences in PM 2.5 during the key lockdown months. They also ran simulations in which they reduced transportation-related emissions and other anthropogenic sources of nitrogen dioxide, mirroring lockdown, when fewer people were driving and fewer industrial sites were operational.
They found the simulation where both meteorology and transportation effects were included most closely mirrored the real-world situation.
“Tackling PM 2.5 is a very complex issue, and you have to take into account its multiple sources, not just the fact that fewer people are on the road,” Hammer said. “Just decreasing transportation emissions would not be enough to account for the complexity of the problem.”
Most satellites sample the atmosphere through vertical columns spanning the ground to the edge of space. Identifying the concentrations of airborne particles near the surface, where they affect air quality, cannot be determined from these satellites alone.
The satellite data used in this study, referred to as aerosol optical depth, were related to surface PM 2.5 concentrations using GEOS-Chem, which simulates the composition of the atmosphere, the reactions and relationships among its different components, and the way they move horizontally as well as vertically through the air.
The model is a sophisticated tool that helps paint a more complete picture of air quality, said Ralph A. Kahn, senior research scientist at NASA’s Goddard Space Flight Center in Greenbelt, Maryland and adjunct professor at University of Maryland in College Park.
“The bigger story is actually the global characterization of air quality, especially in places where there aren’t surface monitors,” said Kahn, who was part of the study. “The satellites provide an important piece of it, the models provide an important piece of it, and the ground-based measurements make an important contribution as well.”
Hammer suspects the change in PM 2.5 levels over the North China Plain was more apparent because of the region’s higher pollution levels during “normal” times.
The new insights also highlight a relevant point that may not at first be intuitive: Average PM 2.5 levels have been dropping steadily in North America and Europe. Pollution concentrations that are already low are more difficult to change, Hammer said.
###
By Brandie Jefferson
Washington University in St. Louis
Media Contact: Roberto Molar Candanosa, NASA’s Earth Science News Team
Media Contact
Ellen Gray
[email protected]
Original Source
https:/
Related Journal Article
http://dx.


