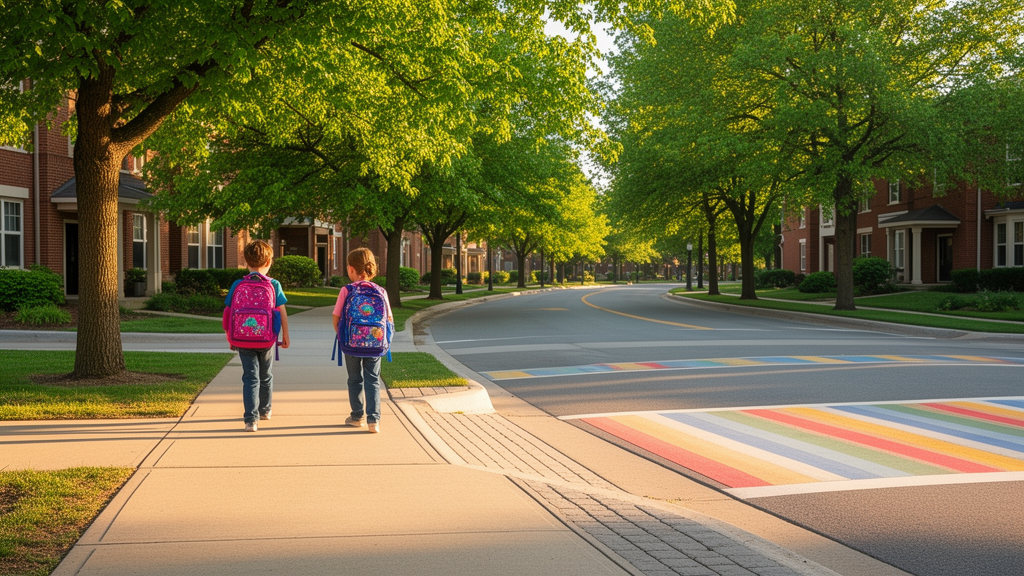
A comprehensive investigation utilizing artificial intelligence and urban spatial modeling has revealed that children walking to school is governed primarily by building density, commuting distance, and subjective street-level perceptions rather than conventional roadway network configurations. Analyzing travel data from primary school students alongside high-resolution street view imagery and geospatial indicators, researchers established that while basic physical feasibility remains an essential prerequisite for active commuting, perceptual evaluations of streetscapes exert a decisive influence once baseline thresholds are attained. The findings shift analytical attention away from traditional macro-scale transit metrics toward the experiential and psychological dimensions of the urban environment experienced specifically from a child’s vantage point.
The imperative to understand school travel choices emerges against a backdrop of steep international declines in active commuting among school-age populations. Walking to school is recognized as an essential component of children’s daily physical activity, emotional and cognitive development, and urban environmental sustainability, yet rates have plummeted over recent decades. In the United States, the proportion of children walking to school fell from 49 percent to 13 percent over a forty-year period, while Canada’s Toronto metropolitan region observed a 53 percent reduction. Past efforts to analyze these behavioral patterns have relied on traditional statistical modeling and the 5Ds urban planning framework of density, diversity, design, destination accessibility, and distance to transit. However, conventional linear models have generated contradictory findings across different urban contexts and struggled to capture the complex, non-linear interactions characterizing pedestrian behavior in dense, polycentric cities.
To investigate these dynamics within a high-density Asian metropolitan setting, the study focused on Xi’an, a major inland metropolis in Northwest China characterized by a concentric-ring urban structure, an intensive concentration of educational institutions, and pronounced vehicular traffic pressure. The research team subdivided the municipality into 572 Traffic Analysis Zones, which functioned as the standardized spatial units for aggregating environmental attributes and evaluating commuting behaviors. This spatial framework encompassed an environmental gradient transitioning from the historic core with high facility concentration to mixed-use inner suburban belts and rapidly developing residential sectors on the outer periphery, allowing researchers to evaluate urban built patterns across diverse spatial configurations.
Empirical data on walking behavior were gathered through structured electronic questionnaires administered across six core urban districts in Xi’an between September and November 2024. Targeting primary students enrolled in grades one through six, trained enumerators conducted face-to-face tablet interviews with voluntary guardian consent, capturing travel companionship patterns, demographic attributes, residential locations, and weekly walking frequencies. The primary dependent variable was defined as the average weekly frequency of one-way walking trips between home and school within each Traffic Analysis Zone. From a total collection of 1,023 surveys, 906 fully validated records were retained for analysis, revealing an overall mean weekly walking frequency of 5.31 trips with a standard deviation of 2.78, indicating substantial behavioral variation across the sample.
To rigorously capture streetscapes at the scale of a child’s perspective, the researchers compiled 100,443 street view images harvested at 50-meter intervals across the road network using the Baidu Maps Street View service. Image capture was configured across four horizontal camera orientations with the pitch angle adjusted specifically to match the physical eye level of children. Using a curated set of 240 representative urban scenes, the researchers executed a pairwise comparison experiment on tablets where young participants completed sixty forced-choice evaluations across five subjective dimensions drawn from Alfonzo’s Hierarchy of Walking Needs: Feasibility, Accessibility, Safety, Comfort, and Pleasurability. These comparative choices were converted into standardized perceptual scores using the Elo rating system and subsequently expanded to the full dataset using a trained Convolutional Neural Network.
In parallel with subjective assessments, objective spatial and visual features were extracted to provide a multi-layered characterization of the school route environment. The researchers applied the DeepLab v3 semantic segmentation architecture to all panoramic street imagery to compute three core visual indicators: the Green View Index, which measures the proportion of visible roadside foliage; the Sky View Factor, which quantifies street openness; and Visual Enclosure, which tracks vertical containment formed by walls and building facades. These street-level observations were integrated with geospatial data obtained via Python interfaces, incorporating Points of Interest to determine land-use mix entropy, topologically verified road centerlines to calculate network intersection density, road betweenness centrality, diversion ratios, and shortest network walking distances to educational facilities and public transit stops.
To analyze this high-dimensional dataset without imposing artificial linear constraints, the researchers conducted systematic algorithm comparisons across Decision Tree Regression, Random Forest, Gradient Boosting Decision Trees, LightGBM, and Extreme Gradient Boosting. All candidate models were trained on 80 percent of the dataset and assessed against a holdout test partition comprising the remaining 20 percent. Predictive performance was evaluated using mean absolute error, root mean square error, and the coefficient of determination. Following hyperparameter optimization using five-fold cross-validation and grid search—which established an optimal learning rate of 0.1, a maximum tree depth of 5, 500 estimators, and a gamma parameter of 1.0—XGBoost outperformed all alternative baselines, achieving a coefficient of determination of 0.60 on the independent test dataset.
To overcome the interpretability limitations of ensemble machine learning, the researchers implemented Shapley Additive Explanations based on cooperative game theory to quantify the exact marginal contribution of each predictor. The resulting feature importance ranking revealed that building density was the dominant predictor of children’s walking frequency, followed by perceived safety and distance to school. Notably, six of the top ten predictive variables—specifically Safety, Sky View Factor, Accessibility, Feasibility, Green View Index, and Visual Enclosure—were direct measures of street perception and objective streetscape geometry. In contrast, conventional road network morphology indicators, including intersection density, betweenness centrality, and diversion ratios, demonstrated comparatively minor overall explanatory significance within the predictive model.
The directional analysis of SHAP values demonstrated that higher building density, perceived safety, walking feasibility, land-use diversity, and route comfort were positively associated with increased walking frequencies, exhibiting characteristic promoting patterns. Conversely, distance to school, excessive spatial openness represented by the Sky View Factor, higher functional accessibility, and high vegetation density demonstrated negative associations with walking frequency. The researchers observed that expansive openness can diminish informal street surveillance and induce feelings of vulnerability in children, while dense street vegetation and high accessibility often correspond with obstructed sightlines, vehicular congestion, and heightened traffic conflicts, thereby undermining parents’ and children’s perceived environmental safety.
Detailed examination of SHAP dependence plots demonstrated distinct non-linear dynamics, threshold boundaries, and diminishing marginal returns across the analyzed variables. For objective street features, the Sky View Factor supported walking at low levels below 0.15, but its effect turned sharply negative beyond that threshold as spatial exposure increased. The Green View Index displayed an ongoing downward trend that turned distinctly negative once visible greenery exceeded 0.20, suggesting that excessive visual obstruction suppresses active commuting. Visual Enclosure exhibited an inverted U-shaped relationship, where optimal pedestrian encouragement occurred within a moderate enclosure band of 0.30 to 0.40, whereas values exceeding 0.40 led to steep declines attributable to visual oppression and claustrophobic spatial constraints.
Subjective perception factors and built environment metrics displayed equally pronounced non-linear tipping points. Perceived safety exhibited an S-shaped trajectory, where negative model contributions persisted below an Elo index of 44, followed by a rapid escalation in walking frequency once this fundamental safety baseline was surpassed. Walking accessibility peaked between index values of 54 and 55 before its marginal utility weakened. Among built infrastructure variables, building density exerted negative effects below 0.15, attained peak positive promotion between 0.20 and 0.30, and receded at higher densities due to vehicular congestion. Commuting distance demonstrated a critical tipping point at 800 meters, beyond which the propensity for walking declined precipitously, while proximity to bus stops and subway entrances peaked sharply at 100 meters and 400 meters, respectively.
Reflecting on these findings, the authors emphasized that urban interventions must move beyond uniform infrastructure investments and adult-oriented planning standards to address the specific perceptual thresholds of child pedestrians. The researchers noted several study boundaries, pointing out that cross-sectional observational designs cannot establish definitive causal relationships, and that static street view data do not capture temporal variations, localized microclimates, or household socioeconomic disparities. Nonetheless, the investigation demonstrates that child-friendly urban transport strategies must prioritize continuous informal surveillance, moderate visual enclosure, child-scale greenery, and the careful mitigation of traffic conflict points within sensitive spatial thresholds to effectively support active school mobility.
Subject of Research: Machine learning analysis of built environment and perceptual factors influencing active school travel
Article Title: Evaluating perceived built environment factors influencing children’s walking to school: an XGBoost–SHAP approach
Article References: Gao, Y., Wang, J., & Wang, H. (2026). Evaluating perceived built environment factors influencing children’s walking to school: an XGBoost–SHAP approach. EPJ Data Science, 15(1), Article 57. https://doi.org/10.1140/epjds/s13688-026-00621-w
Image Credits: AI Generated
DOI: 10.1140/epjds/s13688-026-00621-w
Keywords: active school travel, built environment, urban planning, machine learning, XGBoost, SHAP analysis, child mobility, pedestrian safety, street view imagery, spatial analysis, Evaluating, perceived
News Source: Teresa Odom. (November 11, 2026). Machine Learning Reveals How Street Environments Shape Children Walking to School. Scienmag.