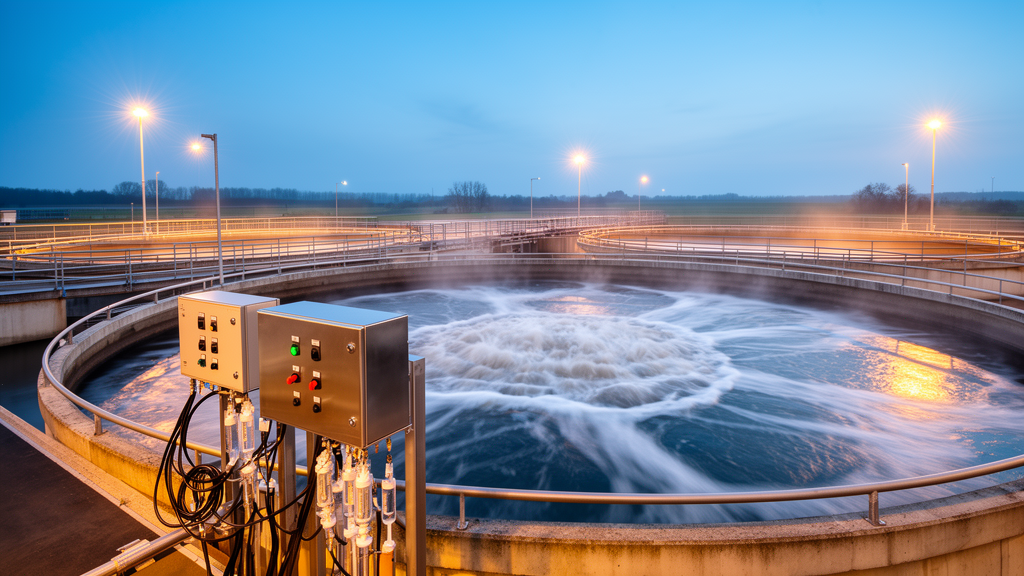
Aeration is the single hungriest process at a wastewater treatment plant, often consuming more than half of the total process energy demand, with reported shares ranging from 40 to 80 percent across facilities. Treating one cubic meter of wastewater typically takes between 0.18 and 0.8 kilowatt-hours of electricity, so even modest improvements in aeration control translate into meaningful savings. The efficiency of that process hinges on a deceptively small number: the alpha factor, the ratio of oxygen transfer efficiency in wastewater to that in clean water. For fine-bubble diffusers it typically falls between 0.3 and 0.85, and it fluctuates constantly with loading, temperature and tank conditions.
A new study in Results in Engineering tackles this problem from an unusual angle. Rather than inventing another machine learning architecture, researchers Beket Bodau, Ehsan Hajibolouri and colleagues asked a more fundamental question: how much does data preparation itself change the accuracy of predicting the dynamic alpha-zero factor, the normalized alpha factor measured in ex-situ off-gas columns and corrected for dissolved oxygen carried over from the sampled tank zone? They also asked whether the impressive accuracy reported in earlier studies survives when models face data from later operating periods or from plants they have never seen. The answers, drawn from a public dataset of 18,467 hourly records from full-scale activated sludge plants in Germany, are sobering for anyone hoping to deploy these models in real aeration control.
The dataset came from Schwarz and colleagues, who measured alpha-zero with ex-situ off-gas pilot reactors fed with sludge from full-scale tanks. Because the column diffusers were cleaned regularly, alpha-zero describes the effect of the mixed liquor itself on oxygen transfer, without the confounding influence of full-scale diffuser fouling. The records cover four process stages: WWTP A1, a high-rate first stage of a two-stage plant with 2,516 rows; WWTP A2, the nitrification stage of the same plant with 2,629 rows; WWTP B, a conventional plug-flow reactor with 8,195 rows; and WWTP C, a conventional closed-loop reactor with 5,127 rows. Seventeen input variables describe influent quality, hydraulic conditions, process conditions, oxygen transfer standardization parameters and sampling position. The mean alpha-zero factor across the combined dataset was 0.673, with a standard deviation of 0.152 and a range from 0.291 to 1.044.
Two earlier studies had already tested machine learning on this same dataset. But both relied primarily on random-row split validation, in which test observations are drawn randomly from the same records as the training data, and neither performed additional preprocessing. The new study instead split the data before any preprocessing, fitted every preprocessing step on training data only, and refitted the pipeline within each cross-validation fold to prevent data leakage. Six models were evaluated: decision tree, random forest, XGBoost, CatBoost, support vector regression and an artificial neural network, with hyperparameters tuned by Optuna and five-fold cross-validation.
On random-row test sets, the results looked excellent. CatBoost was selected for A1, B, C and the combined ALL dataset, while the neural network won for A2. Test R-squared values ranged from 0.872 to 0.924 for individual plant-stage datasets and reached 0.965 for the combined model, with root mean square errors of 0.018 to 0.031 and mean absolute percentage errors of 2.2 to 3.3 percent. Between 95.2 and 99.2 percent of predictions fell within ten percent of measured alpha-zero. Yet the controlled ablation study, which added preprocessing steps one at a time while keeping the model, split and untouched test set fixed, delivered a clear verdict on data cleaning: feature filtering reduced the inputs from 17 to 12 to 15 and changed test R-squared by at most 0.010, simplifying the models without a systematic gain in accuracy.
Outlier removal told a different story. Removing training observations consistently reduced accuracy on untouched test data. The three-sigma criterion excluded 6.1 to 9.2 percent of training rows and lowered CatBoost test R-squared by 0.022 to 0.033 across the four individual datasets. The stricter interquartile range and median absolute deviation criteria removed 17.5 to 34.0 percent of training observations and caused far larger reductions, from 0.055 to 0.285. Across 11 random-row splits, two models and five datasets, three-sigma removal reduced test R-squared relative to the final pipeline in 108 of 110 comparisons. The loss was most pronounced for test observations outside the training-derived three-sigma input range, where CatBoost RMSE rose from 0.018 to 0.053 without row removal to 0.045 to 0.067 after removal. Because measurement errors cannot be reliably distinguished from valid operating extremes without plant logs, the final pipeline retains all training observations and merely flags inputs outside the training-derived range.
The most consequential finding emerged when the models were tested beyond random splits. On a blocked holdout of 168 consecutive observations, test R-squared collapsed to between 0.005 and 0.556 for individual datasets, while RMSE increased roughly 2.4 to 3.0-fold. On a chronological holdout of the final 20 percent of each record, R-squared remained positive only for A1 at 0.603 and turned negative for A2, B and C, ranging from minus 1.199 to minus 1.111. The models systematically overpredicted alpha-zero in the later periods, with mean prediction biases of plus 0.075 to plus 0.113 for A2, B and C. Similar positive biases appeared for simple plant-mean baselines, indicating that the measured alpha-zero level itself was lower in the later observations, possibly due to changes in wastewater composition, seasonal variation or gradual changes in the ex-situ measurement system between cleanings, though the absence of timestamps and maintenance records prevented direct testing of these explanations.
The reason random splits flatter these models lies in the structure of the data. The lag-1 autocorrelation of alpha-zero between consecutive records from the same tank zone was 0.88 to 0.94, and under the random-row split, 95 to 97 percent of test observations had an immediately adjacent row in the training set. In plants B and C, 38 and 45 percent of consecutive row pairs shared identical values of six plant-level operational inputs, and 61 and 71 percent of test observations had a training counterpart matching all six, consistent with parallel ex-situ measurements. Leave-one-dataset-out validation, in which each plant-stage dataset was held out in turn, produced negative R-squared for every excluded dataset, with particularly large errors for A1 at minus 15.40 and A2 at minus 5.98.
Shapley additive explanations analysis revealed which inputs drove the predictions, though the authors stress these are associations, not causal effects. The three leading predictors were airflow rate, dissolved oxygen and water temperature in A1; dissolved oxygen in the sampled zone, water temperature and tank zone in A2; pH, zone dissolved oxygen and water temperature in B; pH, tank zone and zone dissolved oxygen in C; and pH, tank zone and airflow rate in the combined model. Dissolved oxygen or its zone-specific variant ranked among the top three in every individual dataset, while pH ranked first in B, C and ALL. The prominence of pH warrants caution: its correlation with alpha-zero was weak in A1 and A2 but stronger and negative in B and C, where it also correlated with tank zone and electrical conductivity and was higher in later observations where alpha-zero declined, suggesting it may act as a proxy for spatially and temporally varying process conditions rather than a direct physical mechanism.
The study's practical takeaway is twofold. First, keeping all training observations and flagging inputs outside the training-derived range outperformed removing outlier rows, because measurement errors cannot be reliably distinguished from valid operating extremes without plant logs. Second, and more importantly, random-row split validation provides an optimistic estimate of performance on later operating periods, so reliable application requires time-aware validation, representative site-specific data and periodic recalibration. The researchers released a research-prototype prediction tool built on the combined CatBoost model that accepts routine operating data and warns when inputs fall outside the training-derived range, but it has not been validated in plant operation, does not explicitly account for full-scale diffuser fouling, and cannot independently determine the airflow required for aeration control. Independent external validation and operational testing remain necessary before any deployment in aeration control, a reminder that in data-driven engineering, how you test matters as much as what you predict.
Subject of Research: Data preprocessing and machine learning prediction of the dynamic alpha-zero oxygen transfer factor in full-scale wastewater treatment plant aeration
Article Title: Data-driven preprocessing for prediction of the dynamic α₀-factor in full-scale WWTP aeration
Article References: Bodau, B., Hajibolouri, E., Myrzabekova, Z., Ussipbekova, R., Omirbekov, S., Liu, Y., & Wang, Y. (2026). Data-driven preprocessing for prediction of the dynamic α₀-factor in full-scale WWTP aeration. Results in Engineering, 32, Article 113757. https://doi.org/10.1016/j.rineng.2026.113757
Image Credits: AI Generated
DOI: 10.1016/j.rineng.2026.113757
Keywords: wastewater treatment, aeration, alpha factor, oxygen transfer efficiency, machine learning, CatBoost, random forest, data preprocessing, outlier removal, temporal validation, SHAP, activated sludge
News Source: Teresa Odom. (October 30, 2026). Machine learning predicts wastewater aeration efficiency, but only when data stay close to home. Scienmag.