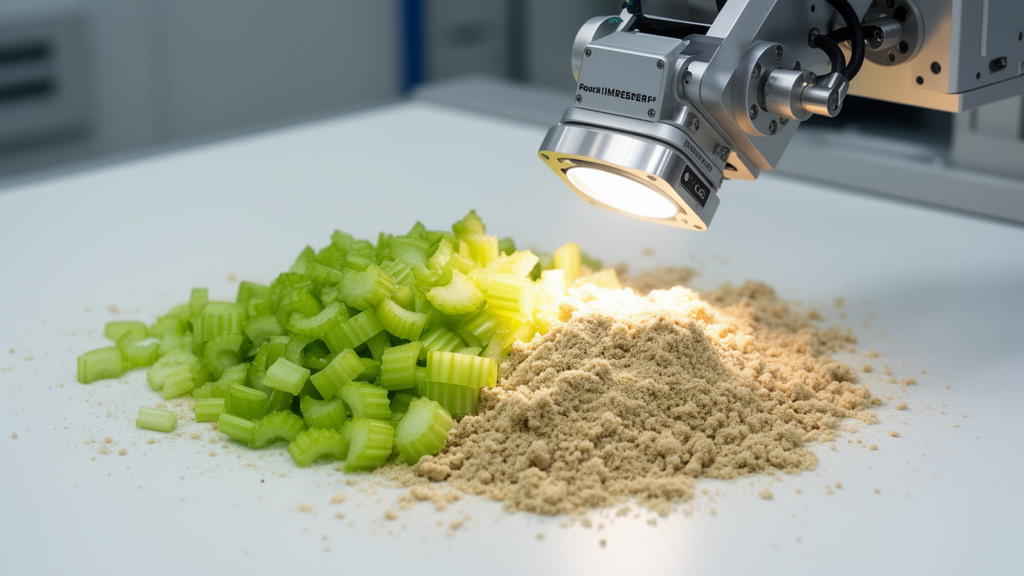
Food authentication researchers have developed a three-dimensional convolutional neural network with joint spectral–spatial attention that identifies stalk celery adulteration and quantifies substitute blending levels from visible and near-infrared hyperspectral images. Cultivated stalk celery commands a substantial commercial premium over ordinary celery and related botanical crops due to its crisp texture and narrow seasonal production window, creating an economic incentive for suppliers to blend it with cheaper Apiaceae tissues. Detecting these substitutions has historically challenged wholesale inspectors because conventional grading relies on visual cues that disappear after produce is trimmed, washed, and shredded, while laboratory chromatography and genetic assays demand destructive sampling and protracted analysis times. To address this inspection bottleneck, the research team constructed an optical screening pipeline that captures spatial texture and continuous spectral reflectance simultaneously, allowing automated discrimination between genuine stalk celery and lower-value botanical substitutes down to five percent blending ratios.
The study specifically tackled economically motivated adulteration involving three common commercial substitutes identified by vegetable market inspectors: parsley leaf and stalk, young shoots and petioles of water dropwort, and fibrous lower petiole segments taken from common Chinese celery. These three plant tissues present distinct analytical challenges that span different categories of regulatory authentication. While parsley and water dropwort represent interspecies adulteration that introduces foreign secondary metabolite profiles and distinct pigment characteristics, lower Chinese celery petiole represents intra-species grade substitution where the adulterant shares the exact same botanical species as the premium crop. The researchers purchased fresh stalk celery directly from a wholesale market in Bengbu, Anhui Province, and prepared controlled blending series ranging from pure celery to fifty percent adulteration by mass, ensuring that every sample was documented with rigorous purchase-lot and preparation-batch records to maintain full analytical traceability.
To assemble the experimental dataset, the investigators prepared 420 independent dish-level samples across seven mass ratios consisting of zero, five, ten, twenty, thirty, forty, and fifty percent adulterant by weight. Each individual dish was formulated through an independent weighing, chopping, mixing, and leveling procedure using an analytical balance with a precision of plus or minus 0.01 grams against a two-hundred-gram total charge, limiting relative weighing error to less than 0.05 percent. The prepared blends were homogenized to particle sizes between two and three millimeters and transferred into matte black circular dishes leveled with a straight edge to suppress specular surface reflections. Raw hyperspectral data were collected using a custom push-broom imaging spectrograph paired with a twelve-bit monochrome charge-coupled device sensor and symmetrical halogen illumination across 256 spectral bands spanning 400 to 1,000 nanometers at a spectral sampling interval of 2.353 nanometers.
The acquired data cubes underwent rigorous preprocessing to remove non-compositional physical artifacts and sensor noise before model ingestion. The researchers applied two-point radiometric calibration using dark-current frames and polytetrafluoroethylene white-panel reference measurements, followed by Savitzky–Golay polynomial smoothing to suppress high-frequency detector noise. Standard normal variate transformation was implemented to normalize individual spectra against their own statistics and neutralize baseline offsets caused by irregular particle scattering. The extreme spectral channels below 433 nanometers and above 958 nanometers were trimmed due to low halogen emission and declining signal-to-noise ratios, leaving 224 calibrated bands spanning 432.9 to 957.6 nanometers. A background segmentation mask established at the 780-nanometer vegetation reflectance threshold isolated plant tissues from the sample dish, after which a fixed region of interest measuring 128 by 128 pixels was extracted from the spatial center of each scanned volume.
The deep learning architecture was engineered to process the volumetric cubes without discarding spatial correlations or inter-band spectral continuity. Unlike one-dimensional networks that treat pixel spectra as isolated vectors or two-dimensional networks that treat spectral bands as disconnected image channels, three-dimensional convolutions slide kernels across spatial rows, columns, and contiguous wavelengths simultaneously. The backbone incorporates four successive 3D convolutional blocks with channel capacities expanding from 16 to 128 while spectral kernel depths shrink from seven to three, reflecting the transition from broad absorption envelopes to finer feature representations. After global average pooling across all three volumetric dimensions, the resulting 128-dimensional latent vector feeds paired output heads: a seven-class softmax classification branch that assigns samples to discrete adulteration tiers and a scalar regression branch that outputs continuous gravimetric adulteration percentages.
A critical architectural innovation within the network is a joint spectral–spatial attention mechanism inserted after the second and third convolutional blocks. The spectral branch performs global average spatial pooling followed by a two-layer bottleneck reduction to compute continuous weighting factors across wavelengths, highlighting absorption features relevant to tissue composition. Concurrently, the spatial branch compresses channel and spectral axes through average and maximum pooling before applying a wide seven-by-seven convolutional aperture to map spatial clustering patterns typical of chopped plant fragments. The two attention maps are joined in series through a learnable residual gate governed by an objective penalty that combines an L1 sparsity constraint on band weights with a reconstruction consistency term, preventing unconstrained gating from discarding critical early-stage features during initial optimization epochs.
In rigorous five-fold cross-validation evaluated strictly at the independent dish level across five random seeds, the proposed attention model attained an overall classification accuracy of 95.2 plus or minus 0.5 percent and a Cohen kappa coefficient of 0.944 on held-out test dishes. This performance significantly surpassed standard chemometric baselines including partial least squares discriminant analysis, which reached 71.4 percent accuracy, support vector machines at 76.2 percent, and random forest models at 78.6 percent. It also outperformed deep learning baselines, exceeding a one-dimensional convolutional network at 82.1 percent, a band-selected two-dimensional network at 85.7 percent, and an attention-free three-dimensional backbone at 90.5 percent. Dish-level McNemar testing confirmed that the performance advantage of the proposed attention network over the identical attention-free backbone was statistically significant with a p-value of 0.008.
The experimental results demonstrated that the primary advantage of the joint attention mechanism was concentrated at the lowest adulteration levels of five and ten percent, where visual and bulk spectroscopic contrasts are weakest. At thirty to fifty percent adulteration, all tested machine learning methods achieved greater than 89 percent accuracy as bulk compositional differences become pronounced. However, in the difficult five to ten percent range, partial least squares accuracy plummeted to 48.6 percent and the plain three-dimensional network achieved only 79.2 percent, whereas the proposed attention architecture maintained 91.7 percent accuracy. Standardized difference spectra revealed that mean spectral deviations between pure celery and ten percent blends remained below 0.15 across the spectrum, proving that detection at low levels cannot rely on global spectral shifts and instead depends on the spatial attention module locating isolated pixel clusters of substitute tissue.
Continuous quantitative estimation executed by the network regression head achieved a coefficient of determination of 0.973, a root mean square error of 2.14 percentage points, and a residual predictive deviation of 6.08 across the complete test set. Between twenty and fifty percent adulteration, prediction residuals remained symmetrically distributed around zero with an empirical dispersion of approximately plus or minus 1.6 percentage points. At the challenging five percent adulteration level, predictions exhibited a slight positive bias of 0.9 percentage points and an expanded residual spread of plus or minus 2.8 percentage points. The authors noted that this increased variance at five percent closely aligns with the plus or minus 2.2 percentage point sampling scatter observed when measuring actual surface-exposed fragment areas against gravimetric charge, indicating that part of the residual deviation reflects physical preparation variance rather than algorithmic failure.
Ablation experiments confirmed the complementary roles of both attention branches and verified the model through physical interpretability tests. Removing the spatial branch dropped overall accuracy to 93.1 percent, while omitting the spectral branch reduced accuracy to 92.3 percent. Back-projecting the learned latent weights onto physical wavelengths revealed that the spectral attention focused heavily on three distinct optical regions: the chlorophyll a absorption trough between 670 and 690 nanometers, the red-edge reflectance slope between 700 and 740 nanometers, and the water absorption shoulder between 944 and 958 nanometers. Systematically occluding these specific wavelength intervals during inference induced the largest performance drops, reducing accuracy by 6.8, 5.1, and 3.4 percentage points respectively, which demonstrates that the network relies directly on measurable physical contrasts in plant pigments, cellular structure, and moisture content.
Evaluating detection accuracy across individual adulterant species revealed that parsley was identified most reliably at 96.4 percent dish-level accuracy, followed by water dropwort at 95.0 percent, while lower celery petiole proved most difficult at 94.3 percent. This ordering directly reflects botanical and chemical divergence: parsley and water dropwort exhibit pronounced differences in chlorophyll density and dry-matter ratios relative to succulent stalk celery, whereas lower petiole tissue originates from the same species and differs only in fiber density and moisture status. When tested under leave-one-adulterant-out cross-species conditions, accuracy dropped to between 81.4 and 84.6 percent, confirming that while the learned features transfer partially across related Apiaceae species, the specific attention weights remain conditioned on the training botanical profiles.
The computational profile of the architecture highlights its potential feasibility for embedded screening while defining necessary hardware requirements. Containing 1.42 million parameters, the network adds only about thirty thousand weights over the plain convolutional backbone, maintaining a compact memory footprint suitable for edge inspection platforms. Inference latency measured 47 milliseconds per cube on a dedicated graphics processing unit, enabling operational throughput exceeding twenty samples per second, whereas central processing unit execution required 312 milliseconds supported by 3.86 billion floating-point operations. The investigators observed that while the model exhibits notable parameter efficiency, line-rate deployment on conveyor sorting systems lacking discrete graphics acceleration would necessitate post-training weight quantization and structural channel pruning to reduce computational arithmetic.
The authors explicitly emphasized several methodological and practical boundaries that constrain immediate industrial deployment. Because all experimental celery was obtained from a single wholesale market during one harvest window and scanned on a single laboratory instrument, the reported accuracies describe generalization to independent dish preparations rather than diverse agricultural supply chains. Repeat testing conducted two weeks later on an independent purchase lot showed an accuracy decline to 86.9 percent due to postharvest physiological shifts. Furthermore, commercial supply chains introduce environmental variables such as refrigeration humidity, storage desiccation, and mechanical bruising that alter the precise pigment and moisture bands exploited by the attention mechanism. Future research must expand hyperspectral datasets across multiple growing seasons, regional cultivars, and portable sensor platforms while exploring sensor fusion to resolve boundary ambiguities in industrial sorting environments.
Subject of Research: Hyperspectral imaging and joint spectral–spatial convolutional neural networks for vegetable adulteration detection
Article Title: A three-dimensional convolutional neural network with joint spectral–spatial attention for celery adulteration detection using hyperspectral imaging
Article References: Gao, H., Wu, T., Fu, Y., Xu, L., Li, L., & Wang, L. (2026). A three-dimensional convolutional neural network with joint spectral–spatial attention for celery adulteration detection using hyperspectral imaging. Frontiers in Nutrition, 13, Article 1972199. https://doi.org/10.3389/fnut.2026.1972199
Image Credits: AI Generated
DOI: 10.3389/fnut.2026.1972199
Keywords: hyperspectral imaging, food authentication, convolutional neural networks, spectral-spatial attention, celery adulteration, food fraud, chemometrics, near-infrared spectroscopy, chlorophyll detection, non-destructive testing, vegetable quality control, deep learning, Apium graveolens, adulteration quantification, agricultural product inspection, image classification, push-broom imaging
News Source: Ophelia Keating. (November 14, 2026). Hyperspectral Imaging Model Detects Celery Adulteration at Five Percent Blending Ratios. Scienmag.