Potato farmers on Prince Edward Island may soon have a sharper tool for deciding when and how much to irrigate. A research team working at the Canadian Center for Climate Change and Adaptation in St. Peter’s Bay has developed a deep learning framework, called the Probabilistic Dynamic Graph Deep Learning model (PDGDL), that predicts the potato crop coefficient (Kc) — the key factor that translates atmospheric evaporative demand into actual crop water use. Across three experimental fields with different soil types and two growing seasons, the model outperformed seven established machine learning benchmarks, achieving coefficients of determination between 0.984 and 0.997 and relative error rates well below the 10 percent threshold considered acceptable for practical prediction.
The crop coefficient sits at the heart of irrigation planning. Reference evapotranspiration, computed with the FAO Penman–Monteith equation from radiation, wind speed, vapour pressure deficit and temperature, describes how much water the atmosphere can draw from a well-watered reference surface. Multiplying that value by Kc yields crop evapotranspiration, the true water demand of the potato stand. The trouble is that Kc is not a fixed number: it shifts with growth stage, soil moisture, weather and soil texture. The traditional FAO tabulated values, the study’s authors argue, often fall short in accuracy and adaptability under changing climatic conditions and local agro-climatic factors, leading either to water wastage from excessive irrigation or to yield losses from underwatering.
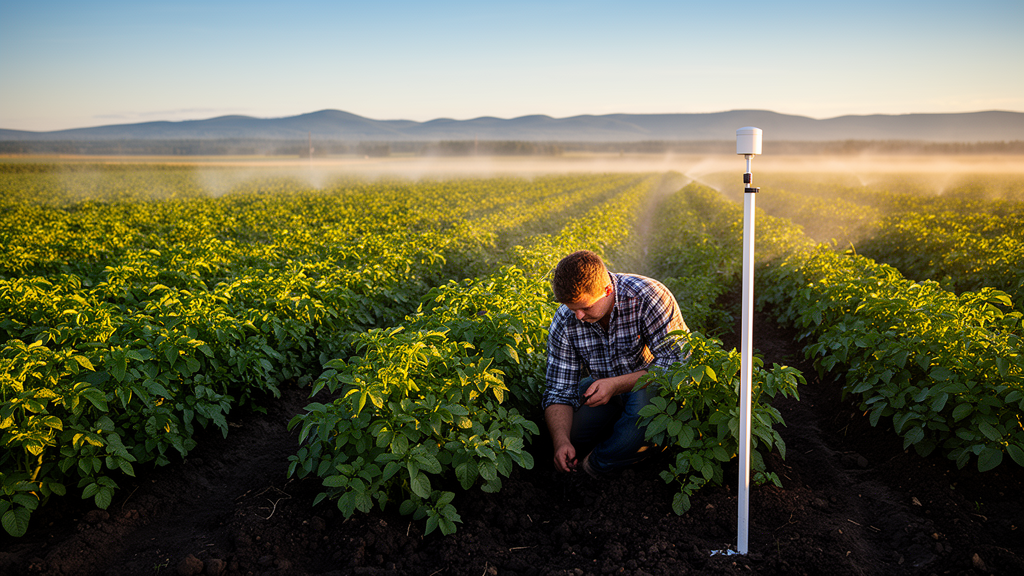
To build a reliable training target, the researchers measured crop evapotranspiration directly using a daily soil water balance. At each of three fields — one on loam, one on sandy loam and one on loamy sand — they installed weather stations recording temperature, humidity, wind speed, solar radiation and rainfall, together with soil moisture sensors at depths of 6, 12 and 18 inches. Irrigation volumes were metered, and surface runoff was considered negligible given the permeable soils and flat topography. Daily crop evapotranspiration was then calculated as irrigation plus precipitation minus deep percolation and the change in soil moisture storage within the rooting depth, and Kc was obtained by dividing this by reference evapotranspiration. Data were collected daily or at 30-minute intervals and aggregated to a daily timescale over the 2023 and 2024 seasons.
What distinguishes PDGDL from conventional forecasting approaches is the way it represents relationships among variables. Classic multivariate regression and recurrent architectures such as LSTM and GRU treat inputs as fixed feature vectors or sequences, handling each variable largely independently. Static graph neural networks go further by encoding relationships among variables, but they assume a fixed topology. PDGDL instead constructs and continuously updates a probabilistic graph in which nodes correspond to agro-meteorological variables — soil moisture, maximum, minimum and mean temperature, relative humidity, wind speed, solar radiation, rainfall, field capacity, wilting point and soil temperature — and edges encode conditional interactions whose probabilities are learned from data and allowed to change over time.
Architecturally, the model follows an encoder-decoder design. An embedding layer first transforms raw time-series observations into high-dimensional latent representations. A causal graph layer then combines two components: a Dynamic Relation Graph Learning layer, which estimates probability distributions of historical and future relation graphs using empirical covariance statistics and a memory-augmented module that stores global correlation patterns from past windows, and a Causal Graph Neural Network that performs multi-hop message passing over the sampled graphs. A reasoning layer subsequently refines these representations by weighting previous temporal states according to their distance and relevance, and an output layer projects the result into future Kc values, feeding predictions back recursively for multi-step forecasting. The maximum hop count was set to three, a compromise the authors found balanced expressiveness against noise and oversmoothing in relatively small agricultural datasets.
The evaluation was deliberately rigorous. Data from June to October 2023 were used for training, while November 2023 to October 2024 were reserved for validation and testing, a time-based split designed to prevent information leakage and mirror real-world deployment where future data are unavailable. The PDGDL model was benchmarked against LSTM, BiLSTM, GRU, a CNN-BiLSTM hybrid, a CNN-GRU hybrid, a static GNN and a dynamic graph neural network, with hyperparameters tuned separately for each field. Beyond the standard metrics of R², RMSE and MAE, the team applied a battery of supplementary measures including Willmott’s index, Nash–Sutcliffe efficiency, Kling–Gupta efficiency, the Theil inequality coefficient, the combined performance index, skill score, Winkler score and average relative interval length.
The results were striking, though not uniformly perfect. PDGDL achieved R² values of 0.995, 0.984 and 0.997 for the three fields, with RMSE values of 0.621, 0.630 and 0.611 and the lowest t-statistics and uncertainty estimates among all models. Its relative mean absolute percentage errors of 5.83, 6.22 and 5.21 percent and relative RMSE errors of 2.82, 3.12 and 2.54 percent all fell comfortably within the acceptable range, whereas the GRU model exceeded 11 percent on relative error in every field. Skill scores for PDGDL reached approximately 96.4, 97.5 and 96.6 percent. One exception stands out: in the third field, the static GNN recorded a lower RMSE (0.511) than PDGDL (0.611), a reminder, which the authors acknowledge, that the new model’s superiority was not consistent across every single metric.
Interpretability emerged as a notable strength. Feature importance analysis showed that soil moisture consistently exerted the strongest influence on Kc prediction across all three fields, followed by solar radiation and temperature-related variables, a pattern consistent with Pearson correlations in the raw data, where soil moisture correlated most strongly with Kc at 0.68. The evolving graph connectivity also mirrored established agro-hydrological principles: soil moisture displayed stronger connectivity during water-limited conditions, while temperature became more influential under high atmospheric demand. Hyperparameter analysis showed best performance at a memory update coefficient of 0.7, a regularization coefficient of 0.001 and a probability threshold of 0.3, with deviations degrading accuracy in interpretable ways.
The model’s costs are equally clear. PDGDL consumed the most computation time and memory of all tested models, averaging 2.7 GB of memory compared with 0.12 GB for GRU, reflecting the overhead of dynamic graph construction and multi-layer processing. The authors suggest that graph sparsification, model compression, limited propagation depth and parallel processing could yield lighter, deployable versions. They also caution that the study used an accepted but limited number of samples from a single potato variety, Russet Burbank, over two years, and that future work should test larger time-series datasets, multiple varieties and larger sample sizes to confirm generalization. For now, the findings position probabilistic dynamic graph learning as a promising route toward precision irrigation — one that could help growers cut water use, lower costs and sustain yields as climate variability makes traditional scheduling tables increasingly unreliable.
Subject of Research: Machine learning prediction of potato crop coefficients for irrigation scheduling in Prince Edward Island, Canada
Article Title: Potato crop coefficient ( K c ) prediction based on encoder-decoder graph learning model
Article References: Diykh, M., Ali, M., Farooque, A. A., Cheema, S. J., Jamei, M., Li, Z., Wang, J., Schumann, A. W., & Yaseen, Z. M. (2026). Potato crop coefficient (Kc) prediction based on encoder-decoder graph learning model. Journal of Agriculture and Food Research, 32, Article 103292. https://doi.org/10.1016/j.jafr.2026.103292
Image Credits: AI Generated
DOI: 10.1016/j.jafr.2026.103292
Keywords: crop coefficient, evapotranspiration, graph neural networks, deep learning, precision agriculture, irrigation scheduling, potato, Prince Edward Island, soil moisture, agrometeorology, water management, crop
News Source: Alan Morgan. (October 24, 2026). Graph-Based AI Model Predicts Potato Crop Water Needs with High Accuracy in Canada. Scienmag.