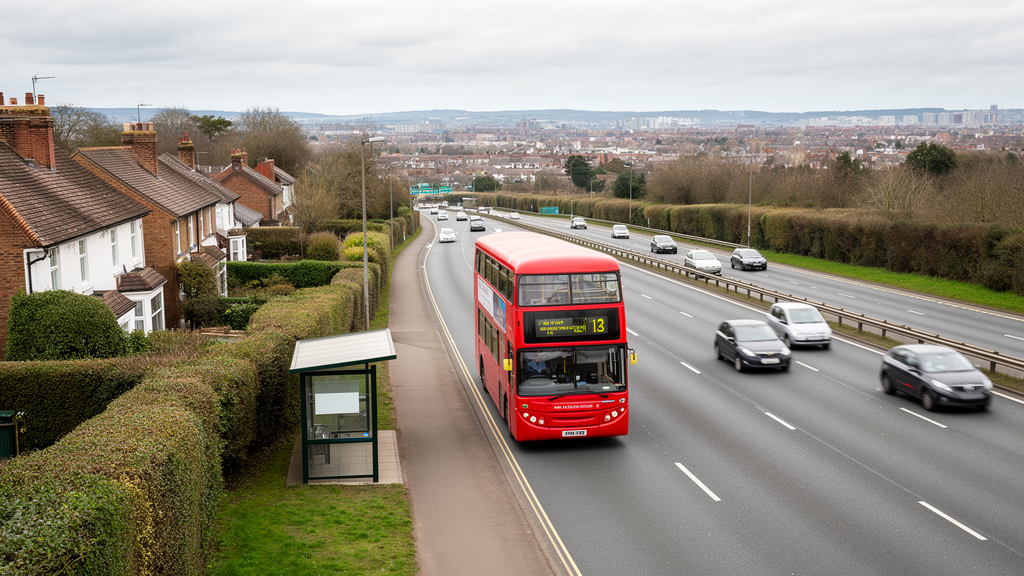
A national analysis of bus travel in England finds that most areas offer substantially less geographical and destination access than cars, with the sharpest disadvantages clustered outside major cities. Researchers calculated what residents of all 33,755 Lower-layer Super Output Areas could reach within a 40-minute journey, comparing the geography and destinations accessible by bus with those accessible by car. Sixty-one point four percent of the areas, containing 60.9% of the resident population, could reach less than 1% of the equivalent car-accessible area. The finding comes from a descriptive study of scheduled bus and road networks, not from an experiment in which services were changed or evaluated.
Accessibility was assessed in two complementary ways. The first was an isochrone area ratio, designated RA, comparing the square kilometres reachable by bus with those reachable by car in the same 40-minute budget. The second was a destination-count ratio, RD, measuring the share of selected employment, education and healthcare destinations reachable by bus relative to those reachable by car. Using both measures matters because a bus network may cover a compact area containing many important destinations while providing little geographical reach. Around 71% of output areas, home to 70.6% of residents, could reach fewer than one in 20 of the destinations available to a car user within the same time limit.
The routes were modelled with the R5 routing engine using openly available bus timetables and OpenStreetMap street data. The analysis represented weekday peak commuting through a Monday departure at 08:30 and used the 25th-percentile journey time across a 60-minute window for buses, allowing time for walking to stops, transfers and journeys involving multiple bus lines. Cars used the default median time. Each reachable area was reconstructed as a polygon, and destination points were counted within it. Ninety-seven output areas with empty, single-point or otherwise implausible geometries were excluded, and the geographically isolated Isles of Scilly was separately omitted from the spatial weights matrix, leaving 33,657 areas in the main regression. Tests with shorter and longer budgets, off-peak and weekend departures, matched travel-time percentiles and a finer routing grid broadly preserved the ranking of areas.
The geographical patterns reveal a pronounced rural disadvantage. Low values of both accessibility measures formed extensive clusters outside major cities, while urban patterns were more heterogeneous and often included small pockets of comparatively high accessibility. London had the largest significant cluster of high area ratios, but its surrounding suburbs included an extensive low-accessibility cluster. The authors suggest that rural bus journeys tend to extend along narrow settlement corridors, whereas faster and straighter rural roads generate comparatively large car isochrones. Lower service frequency and longer waits may further constrain travel. These proposed mechanisms were not tested directly, however; the study measured network outcomes rather than the causal contribution of any particular service feature.
Destinations themselves were generally concentrated more successfully than land area, indicating that bus routes often direct passengers toward useful activity centres despite their limited geographical spread. The mean RD was 0.048, four times the mean RA of 0.012, although this remained very low in absolute terms. Higher RD values tended to coincide with clusters of jobs, schools and medical facilities, particularly in cities and large towns. That overlap could reflect route planning around destinations, but it could also arise because facilities are commonly located in densely populated places with established bus services. The analysis could not distinguish between these explanations. Healthcare showed the greatest spatial clustering, while education was more compressed, a pattern consistent with primary schools often lying within walking distance of homes.
London had the highest regional mean RD, at 0.095, roughly 1.7 times the South West’s mean of 0.057. It also had the greatest internal inequality, with several central boroughs performing strongly while many suburban areas remained near the national average. Eight of the 10 best-performing authorities by mean RD were in London. The South West’s relatively high average was driven substantially by Plymouth, which scored 0.199, while surrounding Devon and Cornwall were closer to their regional median. Some of the lowest county means occurred in southern commuter regions, including Hertfordshire, Hampshire, Worcestershire and Warwickshire. Differences also appeared within the same transport authority, suggesting that local operating and policy conditions may matter alongside broader regional arrangements.
Bus-mediated accessibility was only weakly related to the conventional English Index of Multiple Deprivation. The national Pearson correlation was 0.14, and the relationship was also weak in rural and urban areas separately. In a simple comparison, more deprived urban areas sometimes had better bus access, possibly because many deprived neighbourhoods lie in inner-city locations with dense networks. A preferred spatial model that accounted for both neighbouring outcomes and spatially correlated errors produced a more nuanced pattern. Rural areas had substantially lower destination accessibility, while the share of households without a car or van was the strongest positive predictor. A one-standard-deviation increase in that share, about 16 percentage points, was associated with a direct increase of roughly 46% in RD. The study cannot show whether this reflects demand-responsive provision, the concentration of carless households in better-served places, or both.
Decomposing RD into its bus and car components showed that the major associations were principally bus-side effects. Areas with more carless households reached about 69% more destinations by bus, compared with only about 4% more by car, after adjustment for the model’s other variables. Rural areas reached approximately two-thirds fewer bus destinations than comparable urban areas but nearly the same number of car destinations. Greater deprivation was also associated mainly with reduced bus coverage rather than reduced car access. These results support the narrower conclusion that the disparities described by the study are properties of bus-network reach; they do not demonstrate that changing roads would close the gap. The authors instead frame service frequency, route design and proximity to destination clusters as possible targets for further investigation and investment.
Several limitations constrain the findings. The analysis covers buses but excludes rail and metro, so actual car-free access is likely to be higher in cities with substantial alternative public transport. Car journeys are represented by free-flow road-network travel times without congestion, potentially understating real peak-hour car access in dense urban areas. Scheduled timetables are treated as ground truth even though actual bus running can deviate from them, and the destination dataset dates from 2019 whereas the transport inputs are a January 2026 snapshot. RD counts destination points rather than jobs, pupils or patients, although sensitivity tests showed that alternative employment-size weightings changed the headline result very little. Each output area is also represented by one population-weighted centroid, which may overstate accessibility in large rural areas. Finally, the cross-sectional design cannot establish that London’s franchised system, Plymouth’s investment or any other local policy caused the differences observed; panel data following changes over time would be needed for causal conclusions.
Despite those caveats, the study demonstrates that mobility accessibility can be mapped consistently across an entire country using public data. Its results distinguish bus-mediated access from the geography captured by conventional deprivation measures and show why one measure of coverage is insufficient: bus networks can reach a narrow set of destinations effectively while failing to provide the broad reach available by car. The authors say their open pipeline can be transferred to other countries or applied at finer scales, while future versions could incorporate off-peak and weekend travel, observed rather than scheduled journey times, population-weighted measures of transport risk, and geographic units small enough to expose differences between neighbouring communities.
Subject of Research: National analysis of bus-network accessibility to employment, education and healthcare destinations in England
Article Title: How transport coverage shapes access to opportunities: a national-scale isochrone analysis of bus network accessibility in England
Article References: Townley, S., & Botta, F. (2026). How transport coverage shapes access to opportunities: a national-scale isochrone analysis of bus network accessibility in England. Frontiers in Big Data, 9, 1942887. https://doi.org/10.3389/fdata.2026.1942887
Image Credits: AI Generated
DOI: 10.3389/fdata.2026.1942887
Keywords: bus networks, transport accessibility, isochrones, spatial inequality, public transport, rural-urban divide, social exclusion, England, job access, transport poverty, transport, coverage
News Source: Denise Maddox. (October 22, 2026). England’s Bus Networks Leave Most Areas Far Behind Cars. Scienmag.