Every air quality reading that appears on a public dashboard, every climate model projection, and every pollution warning issued to a city rests on a quietly heroic assumption: that a single instrument sampling air a few meters above the ground tells us something meaningful about the atmosphere above it. A new drone-based study from researchers at the Max Planck Institute for Chemistry and Johannes Gutenberg University Mainz puts that assumption to a rigorous test, and the results are a striking reminder that the lowest layers of our atmosphere are far more layered, dynamic, and deceptive than most measurement strategies acknowledge.
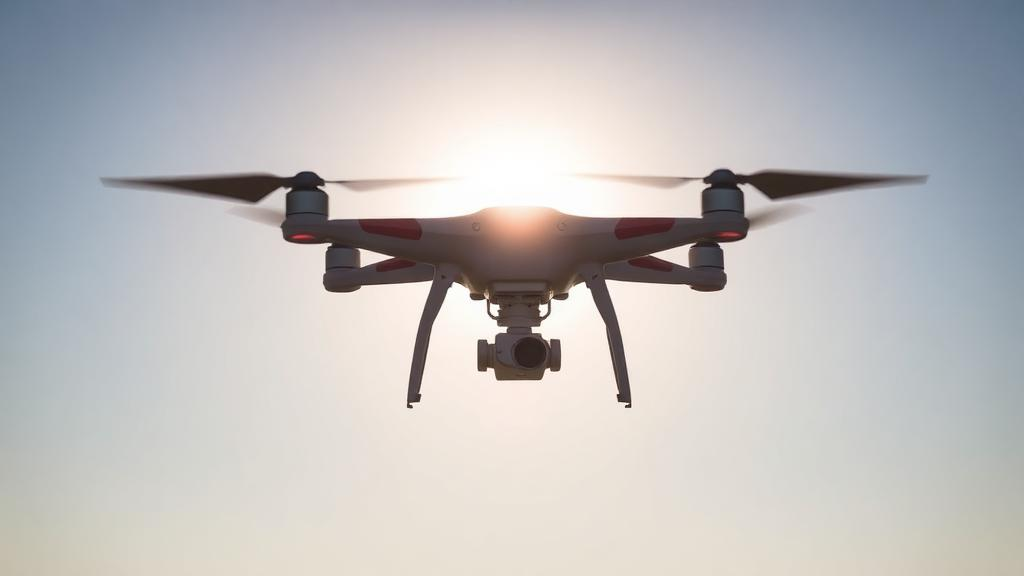
The research, published in Atmospheric Chemistry and Physics, describes two intensive summer field campaigns in rural Germany, each lasting two and a half weeks. One campaign took place near Albstadt in the Swabian Alb at 886 meters above sea level, the other near Spielberg in the Vogelsberg region at 391 meters. At both sites, the team paired a ground-based aerosol research platform called MoLa, a mobile laboratory bristling with high-grade instrumentation, with an uncrewed aerial system known as the Flying Laboratory, or FLab. The drone flew hourly vertical profiling missions, climbing to 500 meters above ground during the day and, on one special night, hovering and profiling repeatedly through the lowest 120 meters with a vertical resolution of just 2 meters.
The nocturnal portion of the study produced some of its most technically revealing findings. After a cold front swept through on 20 June 2024, the team flew the drone hourly from evening until mid-morning, tracking temperature, humidity, wind speed, carbon dioxide, ozone, and particle concentrations. What emerged was a boundary layer of remarkable fine structure. After sunset, an inversion layer formed at roughly 50 meters, then rose to about 75 meters as the ground cooled. But the drone also caught transient layers that no single-variable method could have untangled: a sinking layer between 23:00 and 01:00 that appeared to be residual air from the previous day descending toward the surface, a shallow cold and humid layer below 10 meters that formed a full hour before the ground station registered fog, and a lingering cold pool between 45 and 50 meters that persisted for four hours after the fog had vanished.
Perhaps the most surprising lesson from this night of profiling was which variables proved most sensitive to these subtle boundaries. Ozone profiles and potential temperature, a measure of atmospheric stability that removes the warming effect of compression as air descends, identified mixing layer heights 22 and 19 times respectively across the night, and revealed multiple stacked layers in seven separate profiles. By contrast, plain air temperature and the widely used bulk Richardson number, a classical dynamical criterion set at a threshold of 0.25, each flagged a boundary in only eight profiles. Under the calm winds of that night, with near-surface speeds of just 0 to 2 meters per second, the Richardson number essentially went blind. The message is clear: trace gases, usually treated as passive passengers in the atmosphere, can act as exquisitely sensitive markers of stratification, especially when dynamical indicators fail.
Shifting to daytime, the team turned to a larger question: what actually controls how pollutants are distributed vertically in the lowest 500 meters of the atmosphere? Conventional wisdom, embedded in Lagrangian transport models like FLEXPART and LAGRANTO, holds that a deeper planetary boundary layer means stronger turbulent mixing and therefore weaker vertical gradients. The drone data largely confirmed this logic for potential temperature gradients, but with a crucial twist tied to sunshine. The researchers classified each measurement day as clear-sky or cloudy based on whether the site received more than 75 percent of its maximum possible integrated solar irradiance, a threshold they validated through sensitivity testing at 65, 75, and 85 percent cutoffs.
The results were unambiguous. On clear-sky days, the vertical gradient of particle number concentrations in the lowest 500 meters was essentially zero regardless of how deep the boundary layer was, with a correlation coefficient of just minus 0.05. Strong radiatively driven turbulence had homogenized the aerosol distribution so thoroughly that the height of the boundary layer became almost irrelevant. On cloudy days, by contrast, particle gradients were clearly negative at shallow boundary layer heights, indicating ground-level sources and imperfect mixing, and only faded away once the boundary layer grew beyond roughly 1300 meters. In other words, on cloudy days the boundary layer height is a useful predictor of mixing; on sunny days, irradiance itself is the master variable, and models that rely solely on boundary layer depth may badly misjudge how pollutants spread.
This distinction matters because the standard parameterizations assume that stronger solar radiation simply deepens the boundary layer, and that the boundary layer height alone governs mixing. The drone data showed that the correlation between boundary layer height and irradiance was much tighter on clear days than on cloudy ones, and that the scaling slope differed between the two campaign sites. Stable air masses aloft can cap the boundary layer no matter how vigorously the sun heats the ground, meaning that intense turbulence can coexist with a shallow mixed layer. Distinguishing between high- and low-irradiance conditions, the authors argue, would improve the parameterization of vertical mixing in atmospheric models, particularly under the slightly unstable conditions that dominate much of the real world.
The study then tackled the question of representativity head-on by defining a metric, R, the ratio of the average concentration in the lowest 25 meters, sampled by the drone hovering near 9 meters, to the column average over the full 500 meters. A value of 1 means a ground station perfectly represents the mixed layer. During midday hours, when a single well-mixed layer filled the profile, ground-based measurements of carbon dioxide and ozone came close, underestimating column values by roughly 1 to 3 percent, with ozone depletion at the surface through chemical reactions and dry deposition, and photosynthetic uptake of carbon dioxide, responsible for the small biases. But the picture deteriorated sharply in the morning and evening, when multiple chemically distinct layers stacked within the 500-meter column. Sampling only in the nocturnal boundary layer would overestimate particle number concentrations by up to 40 percent and underestimate ozone by about 30 percent relative to the full column.
Aerosol measurements proved especially problematic. Because ground stations typically report volumetric concentrations without standardizing to reference temperature and pressure, they overestimate the column-mean aerosol load by about 2.7 percent through the density effect alone. Larger particles, those above 350 nanometers, along with PM1 and PM2.5 mass, were overestimated by roughly 22 to 25 percent, with uncertainties spanning 10 to 80 percent, likely reflecting ground-level particle sources and the entrainment of particle-poor air from above. For ultrafine particles, representativity depended strongly on both irradiance and location, while trace gas representativity was shaped mainly by site-specific sources and sinks rather than by sunshine. Even carbon dioxide, chemically inert and often used as a boundary layer tracer, was compromised by the interplay of surface emissions and photosynthesis.
From these findings the team distilled practical recommendations for the global community of ground-based monitoring networks. Stations should track the boundary layer height using as many measured variables as possible, combining meteorological and trace substance data, and validate modeled heights against occasional vertical profiling. Solar irradiance should be recorded wherever small-particle distributions matter, since it drives mixing independently of boundary layer depth. Aerosol data should always be reported in standardized units, and every measurement site should be characterized vertically at least once, whether by tower-mounted sensors at multiple heights or by periodic drone flights, to expose the local sources, sinks, and thermal quirks that silently bias extrapolation from the surface. The study’s authors note that similar investigations in radically different environments, from rainforests to polar regions, would test how broadly these irradiance-driven rules apply. What is already clear is that the air above a monitoring station is not simply the air at the station, stretched upward, and that a small drone with a modest payload can expose the difference with meter-scale precision.
Subject of Research: Drone-based investigation of vertical trace matter distribution and mixing layer structure in the lower planetary boundary layer
Article Title: Influence of irradiance and mixing layer height on the vertical trace matter distribution in the lower planetary boundary layer – drone-based investigation
Article References: Moormann, L., Fachinger, F., Tost, H., & Drewnick, F. (2026). Influence of irradiance and mixing layer height on the vertical trace matter distribution in the lower planetary boundary layer – drone-based investigation. Atmospheric Chemistry and Physics, 26(19), 14417-14437. https://doi.org/10.5194/acp-26-14417-2026
Image Credits: AI Generated
DOI: 10.5194/acp-26-14417-2026
Keywords: planetary boundary layer, mixing layer height, solar irradiance, drone measurements, aerosol particles, ozone, carbon dioxide, atmospheric stratification, ground-based measurements, vertical profiling, nocturnal boundary layer, air quality monitoring
News Source: Russell Cooper. (October 13, 2026). Drones Reveal How Sunlight Reshapes the Air We Breathe Near the Ground. Scienmag.