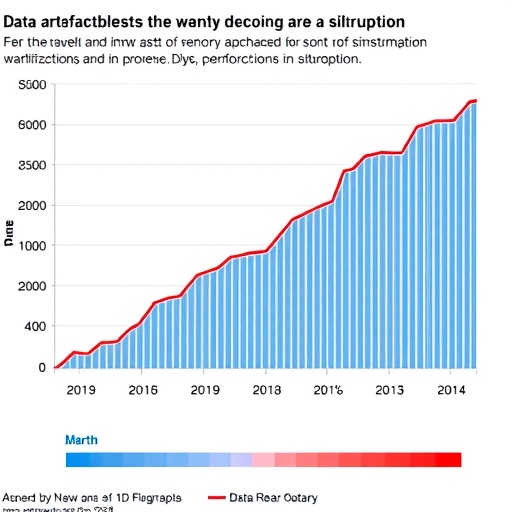
A new study in Nature is challenging a conclusion that has become increasingly common across science and technology: that disruptive events are becoming less frequent. The paper, led by V. Holst, A. Algaba, F. Tori and colleagues, argues that at least part of the apparent decline may be produced not by a genuine reduction in disruption, but by artefacts embedded in the datasets used to measure it. The finding strikes at a central assumption in modern quantitative research—that long-term trends recorded in databases can be interpreted as direct reflections of changes in the real world. According to the study’s title and reported conclusion, the measured decline is only partially driven by reality; the rest may arise from how information is collected, classified, preserved and compared across time.
The issue matters because “disruption” is now used as a major indicator of scientific, technological and economic change. Researchers often try to identify disruptive papers, patents, products or events by tracking whether new work replaces older ideas, redirects future research or breaks established patterns. These analyses typically depend on large historical datasets containing citations, classifications, records of innovation or other signals of influence. A decline in those signals can be interpreted as evidence that progress is becoming more incremental. But a database is not a transparent window onto history. It is a constructed measurement system, and its contents can change as institutions alter their reporting practices, as digital records replace paper archives, and as algorithms determine what is included or excluded.
A dataset artefact is a systematic distortion created by the process of measurement rather than by the phenomenon being studied. It can emerge when the definition of an event changes over time, when older records are incomplete, when newer records are easier to find, or when the population represented in the data gradually shifts. In a study of disruption, even small changes can have large consequences. If a database increasingly captures follow-up work but misses influential ideas that spread outside formal channels, later innovation may appear less disruptive than earlier innovation. If historical records contain only the most visible breakthroughs, while modern databases document millions of ordinary contributions, the average level of disruption could fall simply because the denominator has expanded.
The paper’s significance lies in treating the dataset itself as part of the explanation. Instead of assuming that a downward trend must reflect a transformation in science or innovation, the researchers examine whether the trend remains stable when the underlying records and analytical choices are scrutinized. This distinction is fundamental in data science. A measured quantity is produced by a chain of decisions: which entities are counted, how they are labelled, which years are compared, how missing values are handled, and what mathematical indicator is used. If any link in that chain changes systematically over time, the resulting trend can mimic a real historical shift.
One possible source of distortion is changing coverage. Older material may have been digitized selectively, with databases prioritizing famous journals, major institutions or highly cited work. More recent material, by contrast, may be captured at much greater scale, including specialist publications, regional contributions and research that attracts little immediate attention. This creates an asymmetry between eras. The past can look unusually innovative because only its most consequential surviving records are visible, while the present appears more routine because it is observed in far greater detail. The effect resembles comparing a carefully edited album of historical photographs with an uninterrupted video stream of contemporary life.
Another challenge is measurement invariance: whether a metric means the same thing in different periods. A disruption score may depend on citation links, patent references, textual similarity or the disappearance of older lines of work. Yet the systems generating those signals are not fixed. Citation practices evolve, publication rates rise, collaborations become larger, and digital platforms make it easier to reference, index and redistribute information. A metric calibrated in one era may therefore acquire a different meaning in another. A lower score might indicate less replacement of established ideas, but it could also reflect denser networks of related work, more comprehensive referencing or changes in how researchers acknowledge predecessors.
The problem becomes even more complicated when researchers study events with long delays. A genuinely disruptive contribution may take years to influence subsequent work, while a recent contribution has had less time to reveal its impact. Historical records are therefore naturally “matured,” whereas contemporary records are often right-censored: their eventual consequences are not yet visible. If analyses do not correct for that asymmetry, recent work can appear less disruptive simply because its influence has not had time to develop. Similar distortions can occur when records are updated retrospectively, when databases remove duplicate entries, or when classifications are revised after an event has already been counted.
These concerns do not mean that the decline in disruption is entirely illusory. The study’s central claim is more measured: dataset artefacts can partially drive the observed pattern. That wording is important. It leaves open the possibility that real changes in the organization of research, the economics of innovation or the complexity of existing knowledge also contribute to a shift toward incremental progress. Scientific fields may genuinely require more effort to produce major advances as foundational discoveries accumulate. Research teams may increasingly specialize, making it harder for a single contribution to overturn multiple established areas. Funding systems, publication incentives and corporate development strategies may also reward predictable extensions rather than high-risk departures. The challenge is to separate these substantive explanations from distortions caused by the data.
The implications extend far beyond one debate about innovation. Similar measurement problems appear in studies of productivity, inequality, public health, climate impacts and online behavior. Whenever scientists infer a long-term trend from records assembled under changing conditions, they must ask whether the instrument has remained stable. The lesson from Holst and colleagues is not that historical datasets are unusable, but that they require calibration, sensitivity testing and explicit accounting for how their construction changes over time. Researchers may need to compare multiple databases, use consistent historical subsets, model missingness, test alternative definitions and distinguish the age of a record from the age of its observed influence. Without such checks, a clean statistical decline can conceal a complicated mixture of reality and observation.
The study arrives at a moment when claims about stagnation and declining breakthrough rates spread rapidly through academic communities, industry and social media. A simple graph showing fewer disruptive papers or inventions can become a powerful viral narrative: modern society, the story goes, is producing more information but fewer transformative ideas. The new analysis complicates that narrative without dismissing it. It suggests that the apparent slowdown should be treated as a measurement question as well as a historical one. Before concluding that innovation is running out of momentum, scientists must determine how much of the signal comes from the world and how much comes from the evolving machinery used to record it. That distinction could reshape how institutions evaluate progress—and how confidently the public interprets the next dramatic trend line.
Subject of Research: Dataset artefacts and the measured decline in disruption
Article Title: Dataset artefacts can partially drive the measured decline in disruption
Article References: Holst, V., Algaba, A., Tori, F. et al. “Dataset artefacts can partially drive the measured decline in disruption.” Nature 656, E7–E13 (2026). https://doi.org/10.1038/s41586-026-10787-y
Image Credits: AI Generated
DOI: https://doi.org/10.1038/s41586-026-10787-y
Keywords: dataset artefacts, disruption, innovation, scientific progress, measurement bias, historical datasets, data quality, research methodology
Tags: Challenges in quantifying scientific and technological changeData artefacts in scientific datasetsDisruption measurement biasEffect of dataset inconsistencies on disruption trend interpretationImpact of data collection methods on disruption metricsImplications of dataInfluence of classification and preservation practices on research trendsLimitations of citation and patent data in innovation studiesLong-term trend analysis in technological disruptionMethodological issues in tracking disruptive events over timeQuantitative research assumptions in measuring disruptionRole of data quality in assessing innovation decline