High on a ridge in Germany’s Black Forest, one of the most important climate records in Europe hangs on a technical question of just 23 metres. Schauinsland station, perched roughly 1,000 metres above the densely populated Rhine Valley, has been measuring atmospheric carbon dioxide continuously since 1972, making it the longest-running CO2 time series on the continent. Methane measurements followed in 1991. Now, a team of researchers from Heidelberg University and the German Environment Agency has carried out a meticulous three-year experiment to answer a deceptively simple question: if the station’s air intake were moved from 12 metres above the ground to 35 metres, would the record still mean the same thing? The answer, published in Atmospheric Measurement Techniques, is a nuanced one, and it matters far beyond one mountaintop.
The stakes are higher than they might appear. Greenhouse gas monitoring networks such as the European Integrated Carbon Observation System, or ICOS, and the World Meteorological Organization’s Global Atmosphere Watch programme demand extraordinary measurement consistency. Compatibility targets are set at 0.1 parts per million for CO2 and 2 parts per billion for methane, because the seasonal differences in CO2 between European stations typically amount to only a few parts per million. Even the severe drought and heatwave that struck Central Europe in the summer of 2018 perturbed seasonal CO2 cycles by just 1.4 parts per million in the hardest-hit regions. Against that backdrop, a systematic bias of half a part per million introduced by a change in intake height would be far from trivial. It could ripple through the inverse models that scientists use to estimate how much carbon Europe’s forests, soils and industries emit and absorb.
The motivation for the study was practical. In September 2021, a new air intake line was installed on a radio tower about 50 metres from the station, at 35 metres above ground level, alongside the routine 12-metre inlet that has served the site since 2005. The higher intake was intended to reduce the influence of local surface fluxes, the breath of the surrounding meadows and forests that can contaminate what is supposed to be a regional background signal. To find out whether the two heights told the same story, the researchers equipped each intake with its own Cavity Ringdown Spectroscopy analyzer, allowing truly simultaneous measurements of CO2, methane and water vapour at a temporal resolution of 3.6 seconds. Air from the tower travels down a SynFlex tube, is pre-dried at 2 degrees Celsius, and reaches its analyzer after roughly a minute of transit, a delay the team carefully corrected for.
Before comparing the air itself, the team had to prove the instruments agreed with each other. Following the ICOS calibration protocol, both analyzers were tied to the WMO X2019 CO2 and X2004A methane scales through four calibration cylinders, with regular injections of short-term and long-term target gases treated as unknown samples. The results were reassuring: the mean difference between the two analyzers was 0.014 parts per million for CO2 and a negligible fraction of a part per billion for methane, comfortably within the WMO compatibility goals. Any differences between the two intake heights could therefore be attributed to the atmosphere, not the hardware. With that foundation, the researchers aggregated three full years of parallel data, from 2022 to 2024, into diurnal and seasonal cycles for each intake height.
The CO2 results revealed a striking seasonal asymmetry. In winter, when the surrounding biosphere is dormant, the two intake heights agreed almost perfectly, with differences remaining below plus or minus 0.1 parts per million throughout the day. Summer was another matter entirely. During daylight hours, mean CO2 at 35 metres ran up to 0.5 parts per million higher than at 12 metres, because photosynthesis in the nearby vegetation actively draws down CO2 near the surface, depleting the air sampled by the lower intake. At night the pattern reversed: respiration from soil and plants released CO2 that accumulated near the ground, pushing 12-metre values up to 1.1 parts per million above the 35-metre record. The result was a diurnal amplitude of 5.0 parts per million at 12 metres in summer, versus only 3.9 parts per million at 35 metres. Monthly summer means were on average 0.26 parts per million higher at 12 metres, peaking at 0.56 parts per million.
These numbers are small in absolute terms but large relative to the signals scientists hunt for. The diurnal CO2 cycle carries the imprint of biospheric fluxes, and misrepresenting it can introduce substantial bias in flux inversions at continental and regional scales. The findings also raise an uncomfortable possibility: the vertical gradient the team measured suggests that local biospheric fluxes may have influenced the historic 12-metre record to a non-negligible degree, particularly as vegetation and climate conditions have shifted over recent decades. With the station’s measurement equipment moving to a new building nearby in 2025, the 35-metre record now serves as a stable reference for bridging any discontinuity in the five-decade CO2 series, and complementary eddy covariance measurements using the tower could yield fresh insight into the local biosphere at modest cost.
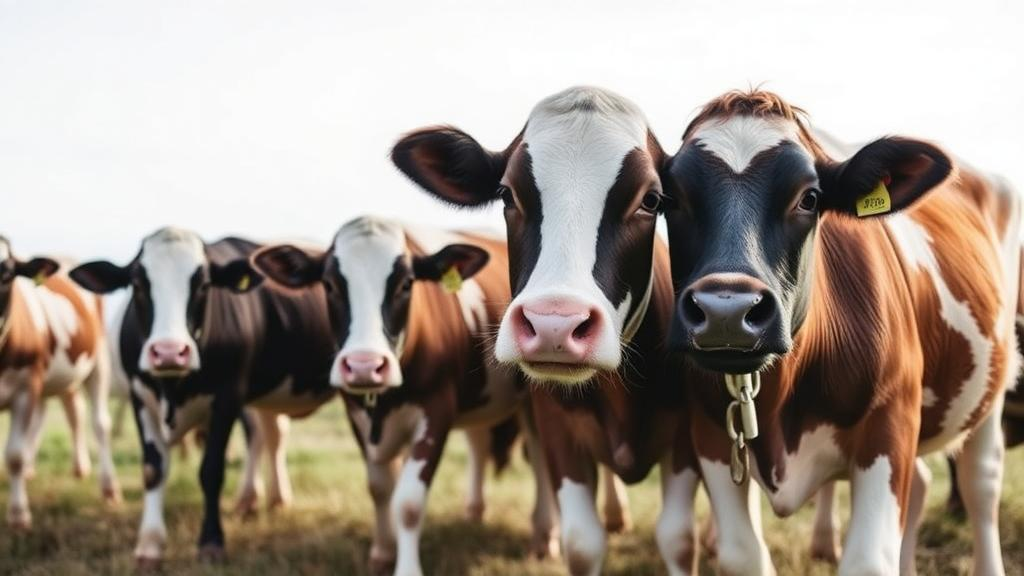
Methane told a very different story, at least on average. Diurnal and seasonal mean differences between the two heights stayed below plus or minus 1.2 parts per billion, well within compatibility goals, meaning the 35-metre record can extend the historic methane time series without a significant break. But the minute-by-minute data exposed a charmingly rural culprit. During the grazing season from May to November, cows on the meadows surrounding the station, some just a few dozen metres from the intakes, produced sharp methane spikes reaching up to 369 parts per billion in minutely data and 38 parts per billion in hourly means at 12 metres. The 35-metre intake, by contrast, remained largely untouched by the bovine emissions. Differences larger than 20 parts per billion appeared three to fourteen times more often during the grazing season than in winter, and the spikes clustered during daytime hours and in air arriving from the west-southwest, where the largest meadows lie.
Filtering out these spikes proved harder than detecting them. Manual flagging was impractical given the sheer frequency of events, and a standard-deviation-based algorithm retained too much contaminated data. The researchers instead turned to the Robust Extraction of Baseline Signal algorithm, or REBS, which models a slowly varying baseline and flags points exceeding it by a tunable threshold. With a 60-minute bandwidth and a stringent threshold parameter of 3, REBS identified 7.9 percent of minutely grazing-season data as spikes, reducing hourly means by up to 27 parts per billion. Yet even this approach struggled during intense spiking periods, when the baseline itself was dragged upward, and the stringent setting tended to over-detect on clean days. Over the full three years, 3.4 percent of hourly values deviated from the original record by more than 2 parts per billion after filtering, and monthly means shifted by up to 1.8 parts per billion, enough to matter for model comparisons.
The team’s recommendation is pragmatic: keep measuring at both heights. The 12-metre inlet preserves continuity with the historical CO2 record spanning more than five decades, while the 35-metre data provide an essential reference for detecting bias, and the cleaner methane record at 35 metres should anchor future analysis. For the historic 12-metre methane data, applying spike detection during the grazing season, with human oversight, could remove a subtle but real contamination. In an era when the European land carbon sink appears to be weakening under heat and drought, and when every tenth of a part per million shapes our understanding of who emits and who absorbs, the Schauinsland study is a reminder that climate science sometimes turns on the finest of margins, and that even cows deserve a footnote in the global carbon budget.
Subject of Research: Comparative analysis of atmospheric CO2 and CH4 measurements at 12 m and 35 m intake heights at the Schauinsland long-term monitoring station in Germany
Article Title: Atmospheric CO2 and CH4 measurements at Schauinsland station, Germany: a comparative study of diurnal and seasonal variations at 12 and 35 m intake height
Article References: Großmann, J., Meinhardt, F., Hoheisel, A., Hellack, B., & Schmidt, M. (2026). Atmospheric CO 2 and CH 4 measurements at Schauinsland station, Germany: a comparative study of diurnal and seasonal variations at 12 and 35 m intake height. Atmospheric Measurement Techniques, 19(19), 6469-6485. https://doi.org/10.5194/amt-19-6469-2026
Image Credits: AI Generated
Keywords: Schauinsland station, carbon dioxide, methane, greenhouse gas monitoring, ICOS, intake height, diurnal cycle, seasonal cycle, cavity ringdown spectroscopy, REBS spike detection, Black Forest, long-term time series
News Source: Russell Cooper. (October 14, 2026). Cows, Canopies and Climate: Why a Few Metres of Height Matter for Europe’s Longest CO2 Record. Scienmag.