The visualization tool, called Carbon Catalogue, breaks down the carbon footprint of a product during its entire life cycle
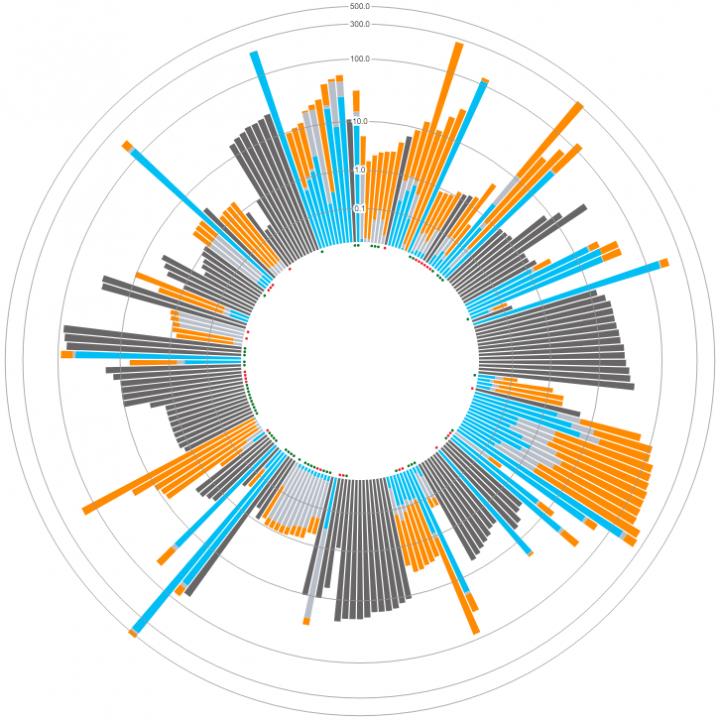
Credit: CoClear
A Columbia researcher affiliated with the Data Science Institute has created a data-visualization tool that shows the carbon footprints of hundreds of consumer products. The tool makes it easy for everyone to explore the products’ carbon-emission levels and the various strategies that companies are employing to reduce emissions.
The visualization tool, called Carbon Catalogue, breaks down the carbon footprint of a product during its entire life cycle, illustrating the carbon it emits during the raw material, manufacturing and later downstream phases. The data show that several companies have made vast improvements in reducing their products’ emissions. Some have instituted sustainable practices such as reducing packaging for food and beverage products, while others replaced fossil fuel with bio energy or lowered the energy consumption of computers.
“This free tool can serve as an inspiration for other companies to reduce their products’ emissions, especially since smaller carbon footprints often correlate with reduced production costs,” says Christoph Meinrenken, an associate research scientist at The Earth Institute and chief data scientist at CoClear, an environmental analytics firm.
The visualization looks like a wheel with color-coded spokes, each representing a consumer product such as a cell phone, a car, or a pair of jeans. When a user hovers over a spoke, a pop-up box appears with a summary of a product’s life-cycle data, including improvements companies made to reduce its carbon emissions. Working with CoClear, Meinrenken analyzed carbon emissions data for 866 products made by 145 companies from 28 countries. The companies voluntarily submitted the data to CDP (formerly the Carbon Disclosure Project), a nonprofit that asks companies to complete detailed questionnaires about their products’ emissions data. The researchers used life-cycle data submitted to CDP on products from 2013-2017 to create the visualization, whose menu allows viewers to search by company, industry or year.
“We designed Carbon Catalogue, which is free and open to all, to enhance awareness of carbon sources and ways to reduce them,” says Meinrenken, who also belongs to the Earth Institute’s Research Program on Sustainability Policy and Management. “The tool gives consumers and CDP-member companies like Nestle, Bloomberg and Dell an interactive platform to explore products’ carbon footprints.”
Meinrenken and his CoClear colleagues found that upwards of 75 percent of a product’s overall emissions were not generated during the manufacturing process, as one might expect, but rather during the supply-chain phase, such as when raw materials are acquired or when consumers later use the products. The food and beverage industry, for instance, which relies heavily on agricultural inputs, had one of the highest upstream emissions, while the IT industry, with its energy-consuming screens and computers, had one of the highest downstream emissions.
“Only by comparing upstream and downstream emissions can you find the hotspots that tell you where you can eliminate the most carbon,” says Meinrenken. “We hope that product managers will use the visualization to see how their products’ carbon footprints fare in comparison to comparable products made by competitors and find ways to reduce emissions.”
###
Media Contact
Robert Florida
[email protected]
201-725-6435
Original Source
https:/


