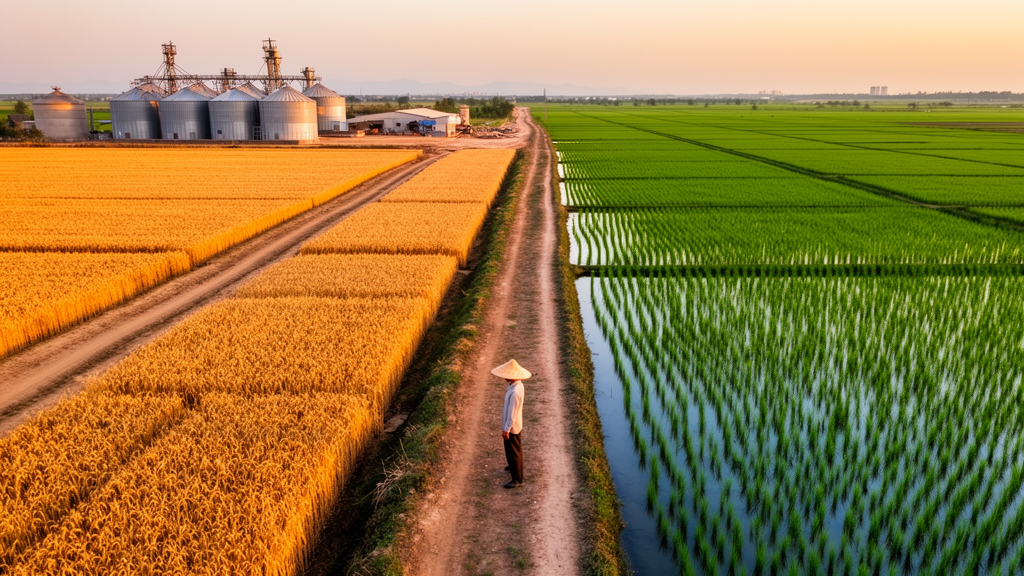
China’s most productive farming provinces grow food for the whole country, but a new study shows they also grow something less welcome: enormous quantities of greenhouse gas emissions that are then shipped, embodied in grain and vegetables, to wealthy coastal cities. Using a multi-regional input–output model covering 31 Chinese provinces and six major crops, researchers have mapped agricultural carbon footprints from both the production side and the consumption side for the year 2017, exposing a sharp spatial mismatch between where crop emissions are generated and where the food that carries them is actually eaten.
The study, published in the journal Carbon Neutrality, was led by Yifan Wu, Meng Li, Jingyu Liu and Yong Geng. The team disaggregated China’s agricultural sector into seven subsectors—wheat, paddy rice, soybeans, maize, vegetables, fruits, and other products—and expanded the technical coefficient matrix of the national interprovincial input–output table from its original 1302 by 1302 structure to a new (186 + 1302) by (186 + 1302) format. The 186 added rows and columns represent the six crop categories across 31 provinces, allowing carbon flows to be traced crop by crop rather than for agriculture as a whole.
The accounting followed a cradle-to-gate framework, capturing direct emissions from field activities such as nitrous oxide from nitrogen fertilizer and methane from flooded paddies, together with indirect emissions from producing and transporting inputs like fertilizers, pesticides, plastic mulch, seeds, and electricity. Nitrous oxide intensities came from a global crop-specific study based on extensive field observations, converted to carbon dioxide equivalents using a 100-year global warming potential of 265. Methane from paddy cultivation was calculated separately for each province. Soil carbon sequestration was excluded from the system boundary because of limited data and its comparatively small contribution relative to other emission sources.
The results show that emissions concentrate in China’s eastern agricultural heartlands. The Middle and Low Yangtze River plain recorded the largest regional total, 295.99 teragrams of CO2 equivalent, driven largely by paddy rice, which alone accounted for 149.85 teragrams, or 49.18 percent of the national paddy total. The Huang-Huai-Hai Plain followed with 144.66 teragrams and the Northeast Plain with 88.85 teragrams, their emissions dominated by intensive wheat and maize cultivation. At the provincial level, Jiangsu ranked first with 96.29 teragrams of CO2 equivalent, 12.39 percent of the national total, followed by Henan at 49.57 and Shandong at 45.17 teragrams. Western provinces such as Tibet and Qinghai each emitted less than one teragram.
Crop-level patterns are strikingly concentrated. Henan, Jiangsu, Shandong, and Hebei together produced 64.76 percent of national wheat production emissions, with Henan alone contributing 18.51 teragrams. Paddy emissions clustered in Hunan, Jiangxi, Jiangsu, and Heilongjiang, which jointly accounted for 45.73 percent of the national total. Heilongjiang dominated soybean emissions, contributing 41.64 percent of the national figure. Emission structures also differed by crop: nitrogen fertilizer was the dominant source for wheat and maize, reaching roughly 8,030 gigagrams of CO2 equivalent in Henan’s wheat fields and 5,947 gigagrams in Shandong’s, while methane dominated paddy footprints, exceeding 25,325 gigagrams in Hunan and reaching about 18,652 gigagrams in Heilongjiang.
Consumption-based accounting tells a very different story. Emissions responsibility shifts away from farming provinces toward densely populated, highly urbanized regions. Guangdong led consumption-based emissions at 57.84 teragrams of CO2 equivalent, followed by Shanghai at 34.12 and Beijing at 17.97 teragrams. Neither Beijing nor Shanghai has significant paddy cultivation, yet their consumption-based paddy emissions reached 3.75 and 16.26 teragrams respectively, comparable to several major rice-producing provinces. Beijing’s consumption-based maize emissions of 4.73 teragrams dwarfed its local production emissions of just 0.21 teragrams, and Guangdong showed a similar gap, consuming 4.25 teragrams of embodied maize emissions while producing only 0.70.
Tracking embodied carbon through interprovincial trade, the researchers found that the Northeast China Plain, with a net outflow of 30.45 teragrams, and the Middle–Lower Yangtze Plain, with 12.11 teragrams, were the largest carbon-exporting regions. Heilongjiang recorded the largest provincial net outflow at 22.75 teragrams, followed by Hebei at 15.62, with Jiangsu, Jiangxi, Hunan, and Guangxi also exporting 9.98, 9.25, 8.16, and 8.12 teragrams respectively. On the importing side, Beijing, Shanghai, and Guangdong posted net inflows of 16.35, 12.71, and 12.06 teragrams, while the Loess Plateau and South China imported 18.26 and 23.28 teragrams. The flows trace a classic north-to-south grain transport pattern, with Heilongjiang’s paddy and maize emissions and Hebei’s wheat, maize, and vegetable emissions flowing mainly to economically developed regions.
The economic dimension of this imbalance is equally pronounced. Net outflows of agricultural value-added correlated strongly with net carbon outflows, with a Pearson correlation of 0.89065 and an R-squared of 0.79326. Heilongjiang and Hebei exported both the most carbon and the most value-added, each with carbon outflows exceeding 15 teragrams and value-added outflows exceeding 40 billion yuan, yet both have relatively low per capita GDP—meaning they bear heavy carbon burdens for modest economic returns. Jiangsu stands out as an exception: despite per capita GDP above 100,000 yuan, it exported 9.98 teragrams of carbon but only 3.23 billion yuan in value-added, a far weaker trade-off than Jiangxi and Hunan, which exported similar carbon but 11.45 and 19.55 billion yuan in value-added respectively. Henan, despite enormous agricultural output, was actually a net carbon importer, with an inflow of 11.14 teragrams, reflecting its large population and high demand.
The authors argue that these findings call for region-specific mitigation strategies rather than one-size-fits-all policies. Net-exporting provinces could optimize production structures and extend agricultural value chains to improve returns, while net-importing, consumption-oriented regions could share responsibility by transferring technology, providing financial support, and guiding consumers toward lower-carbon food choices. The study also suggests that integrating consumption-based accounting into China’s carbon budgeting could address potential carbon leakage, since the country’s current carbon management framework is mainly production-based and its national carbon market, operating since July 2021, does not yet cover agriculture.
Several limitations frame the results. The analysis relies on the 2017 interprovincial input–output table, the most recent dataset with complete provincial coverage available to the team, so the findings characterize China’s agricultural carbon footprint structure around that year, although the authors cite evidence that the overall spatial pattern has changed only marginally since then. Trade flow estimation cannot capture every real-world transaction, including emerging online sales channels, and the fruit category covers only apples, mandarins, and oranges. Even with these caveats, the study offers one of the most detailed pictures to date of how China’s food system distributes not just calories, but climate responsibility—showing that the provinces feeding the nation are also, largely unseen, absorbing its agricultural emissions.
Subject of Research: Provincial carbon footprints of six major crops in China from production and consumption perspectives
Article Title: Measuring carbon footprints of major crops in China: spatial distribution features and carbon burdens from both production and consumption perspectives
Article References: Wu, Y., Li, M., Liu, J., & Geng, Y. (2026). Measuring carbon footprints of major crops in China: spatial distribution features and carbon burdens from both production and consumption perspectives. Carbon Neutrality, 5(1), Article 20. https://doi.org/10.1007/s43979-026-00175-w
Image Credits: AI Generated
DOI: 10.1007/s43979-026-00175-w
Keywords: carbon footprint, agriculture, China, multi-regional input-output, embodied carbon, greenhouse gas emissions, paddy rice, wheat, maize, soybean, interprovincial trade, carbon neutrality
News Source: Alan Morgan. (October 29, 2026). China’s Crop Carbon Footprints Reveal a Stark North-South Emissions Divide. Scienmag.