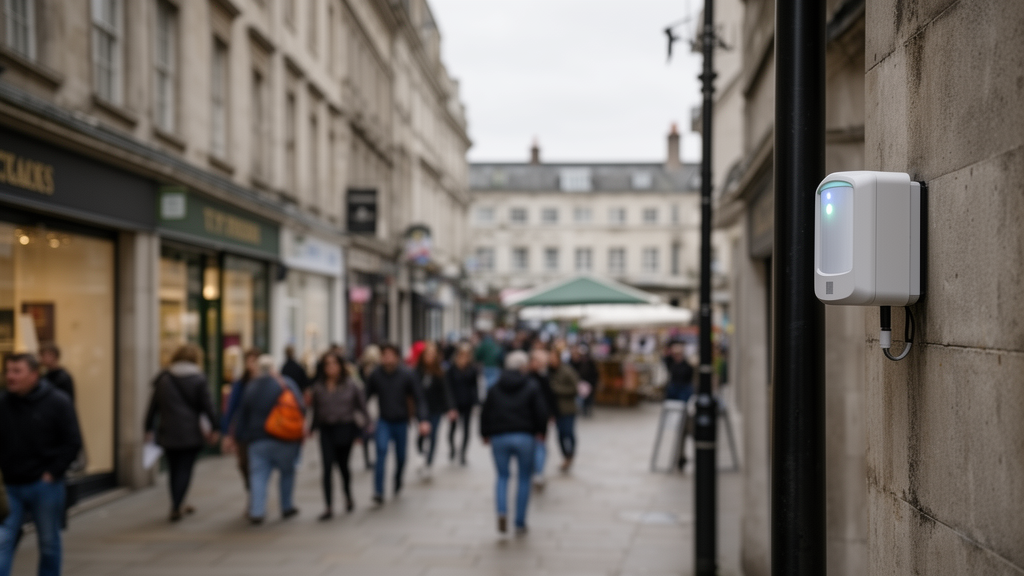
Raw WiFi sensors installed across a British market town systematically miss roughly half of the pedestrians walking past them, according to a new study that both quantifies the problem and demonstrates a practical fix. Researchers working in Loughborough town centre, Leicestershire, found that uncalibrated WiFi detections captured an average of just 50.28% of actual footfall across eight urban sites, with accuracy at individual locations ranging from a low of 21.7% on Biggin Street to a high of 87.7% on Swan Street. By developing site-specific calibration factors grounded in manual counting campaigns, the team raised average estimation accuracy to 85.8%, equivalent to a mean percentage error of 14.2%, and used the corrected data to produce high-resolution maps of pedestrian movement that differ markedly from what the raw sensors alone would suggest.
The research, published in Computational Urban Science, addresses a well-known weakness in low-cost urban sensing. WiFi scanners operate passively, detecting the anonymised media access control probe requests that smartphones broadcast while searching for networks. The system counts unique device addresses within each sensor’s detection zone, an area of roughly 100 square metres, during one-hour intervals. Because the data is aggregated and contains no personally identifiable information, the authors note it complies with GDPR requirements. But the counting mechanism is vulnerable to several documented distortions: MAC address randomisation fragments detections, variable smartphone carriage rates differ across demographics, signal propagation behaves unpredictably in dense built environments, and devices in passing vehicles or nearby buildings can masquerade as foot traffic.
The study area comprised eight distinct character zones in Loughborough, from the primary retail core of Market Place to secondary shopping streets, the mixed-use hubs of Church Gate and Woodgate, the student-focused Ashby Square, the large-format retail area of The Rushes, and the formal recreational space of Queen’s Park. One WiFi scanner stood at a representative pedestrian node in each zone, positions chosen by the local Business Improvement District to maximise network-wide coverage. An initial one-hour pilot at Market Place, comparing raw sensor output against a human observer, yielded an accuracy of only 27%, prompting a systematic ground-truthing campaign across all eight sites.
That campaign relied on manual counts as the reference standard. Observers recorded pedestrians on mobile phones during two two-hour sessions on a single weekday, from 08:00 to 10:00 and 11:00 to 13:00, timed to capture the morning commute and lunchtime peaks. Counts were synchronised with the WiFi data intervals and restricted to each sensor’s detection zone, with random site visits checking protocol compliance. Dual-observer pilot tests estimated human counting error at around plus or minus 5%. From these paired observations, the researchers computed a scaling factor for each site, the ratio of manual counts to WiFi counts, averaged the hourly factors into a single per-site coefficient, and applied it multiplicatively to the full hourly dataset. A density-weighted averaging variant was also tested but consistently produced overestimations through overfitting, so the simple average was adopted.
The scale factors themselves revealed how strongly local context shapes sensor behaviour. They ranged from 0.55, recorded on Swan Street during the morning commute where queued buses inflated counts with the devices of stationary passengers, to 7.25 on Biggin Street at the lunchtime peak, indicating severe undercounting amid dense restaurant crowds. Biggin Street required the largest correction overall, while Swan Street’s daily factor stayed closest to 1.0. After calibration, the mean percentage error across all locations fell to 14.2%, with individual site errors ranging from 5.23% at The Rushes to 22.34% at Market Place. Validation at four randomly selected locations showed calibrated accuracies of 83% at Market Place, 89% at Baxter Gate, 84% at Swan Street and 91% at Queen’s Park.
Not every anomaly vanished. The most extreme post-calibration errors, outliers exceeding 100%, clustered in the 08:00 to 09:00 slot at Ward’s End, Swan Street and Market Place, and field investigations traced them to specific environmental causes. Overcounting at Ward’s End stemmed from queued cars at a car park entrance whose devices the sensor registered; Swan Street’s inflation came from stationary buses and waiting passengers; and persistent underestimation at Market Place was linked to customers lingering in a coffee shop’s outdoor seating area, where prolonged stationary behaviour and signal occlusion complicated detection. The authors argue these systematic anomalies are not random noise but reproducible artefacts of a location’s morphology, land use, behavioural patterns and localised signal interference, which they summarise as a socio-technical signature of place.
The calibrated counts then served as inputs for geostatistical interpolation. The team selected kriging over simpler deterministic methods such as inverse distance weighting because it explicitly models spatial autocorrelation and produces prediction variance alongside its estimates, an advantage in a data-sparse urban network. With only eight sensors, however, conventional leave-one-out cross-validation proved statistically volatile, since removing any single sensor eliminates 12.5% of the data. Reliability was instead assessed through structural consistency: the interpolated surface honours the eight empirically verified anchor points, and the resulting spatial hierarchy matches well-established pedestrian patterns in the town centre. The authors flag expanding the sensor network as a priority to enable conventional validation at unmonitored locations.
The mapping exercise exposed how badly raw data can mislead. In the uncalibrated maps, Market Place dominated as the primary hotspot, with estimated daily counts between 5,355 and 8,621, while Queen’s Park, Ashby Square and The Rushes appeared as cool zones. After calibration, Market Place’s estimated counts rose to a range of 13,735 to 25,928, Biggin Street emerged as a key hotspot at 18,554, and Ashby Square jumped from 4,574 to 15,185, shifting from apparent low activity to a high-activity zone. The town centre’s top three corridors changed accordingly: raw data had ranked Market Place, Swan Street and Ward’s End as the busiest routes, but calibrated data reordered them as Market Place, Biggin Street and Ashby Square. Left uncorrected, the authors note, such distortions could misdirect investments like priority crossings or kerbside management toward areas without genuine need.
The framework’s practical appeal lies in its economy. Achieving 85.8% accuracy required only four to six hours of ground-truth counting per site, carried out by two observers during representative peak periods, making the method accessible to resource-constrained municipalities that already operate WiFi sensors as part of existing smart-city infrastructure. The authors position the approach against three alternatives: global uniform scaling factors, which their observed 13-fold spread in factor values shows cannot cope with spatial heterogeneity; time-of-day adjustments, which correct temporal patterns but ignore spatial root causes; and machine learning models, which demand extensive training data and lack interpretability. Each calibration coefficient here remains transparent and interpretable, indicating where WiFi sensing works well, such as open plazas with clear sightlines, and where supplementary counting is needed, such as transit hubs and café districts.
Important limitations remain. The scaling factors assume detection rates stay stable across typical weekdays, an assumption validated within the study’s scope but not tested for weekends, special events, seasonal peaks or varying weather, all of which could alter pedestrian composition and movement dynamics. The case study covers a single town centre over a limited timeframe, and the framework’s transferability to cities with markedly different morphologies, transport systems and climates has yet to be tested empirically. The authors’ proposed next steps include dynamic, context-aware calibration that adjusts for time of day and events, multi-modal data fusion combining WiFi with Bluetooth or anonymised computer vision, and testing whether the dwell-zone and friction-zone error signatures they identify, undercounting in spaces designed for lingering and overcounting in congested areas, hold universally across diverse cities. Within those bounds, the study offers a concrete demonstration that cheap, privacy-preserving sensor data can be converted into reliable planning intelligence, provided the sensors are taught to understand the places they watch.
Subject of Research: A location-aware calibration framework for correcting bias in WiFi-based pedestrian counting sensors
Article Title: Mitigating sensor bias: a location-aware calibration framework for pedestrian analytics
Article References: Shamroukh, M., Natapov, A., & Larimian, T. (2026). Mitigating sensor bias: a location-aware calibration framework for pedestrian analytics. Computational Urban Science, 6(1), Article 65. https://doi.org/10.1007/s43762-026-00295-0
Image Credits: AI Generated
DOI: 10.1007/s43762-026-00295-0
Keywords: WiFi sensing, pedestrian counts, sensor calibration, urban analytics, Loughborough, kriging interpolation, MAC address randomisation, smart cities, ground-truth validation, pedestrian flow mapping, data bias, urban planning
News Source: Denise Maddox. (October 28, 2026). Calibrated WiFi sensors reveal true pedestrian flows in UK town centre. Scienmag.