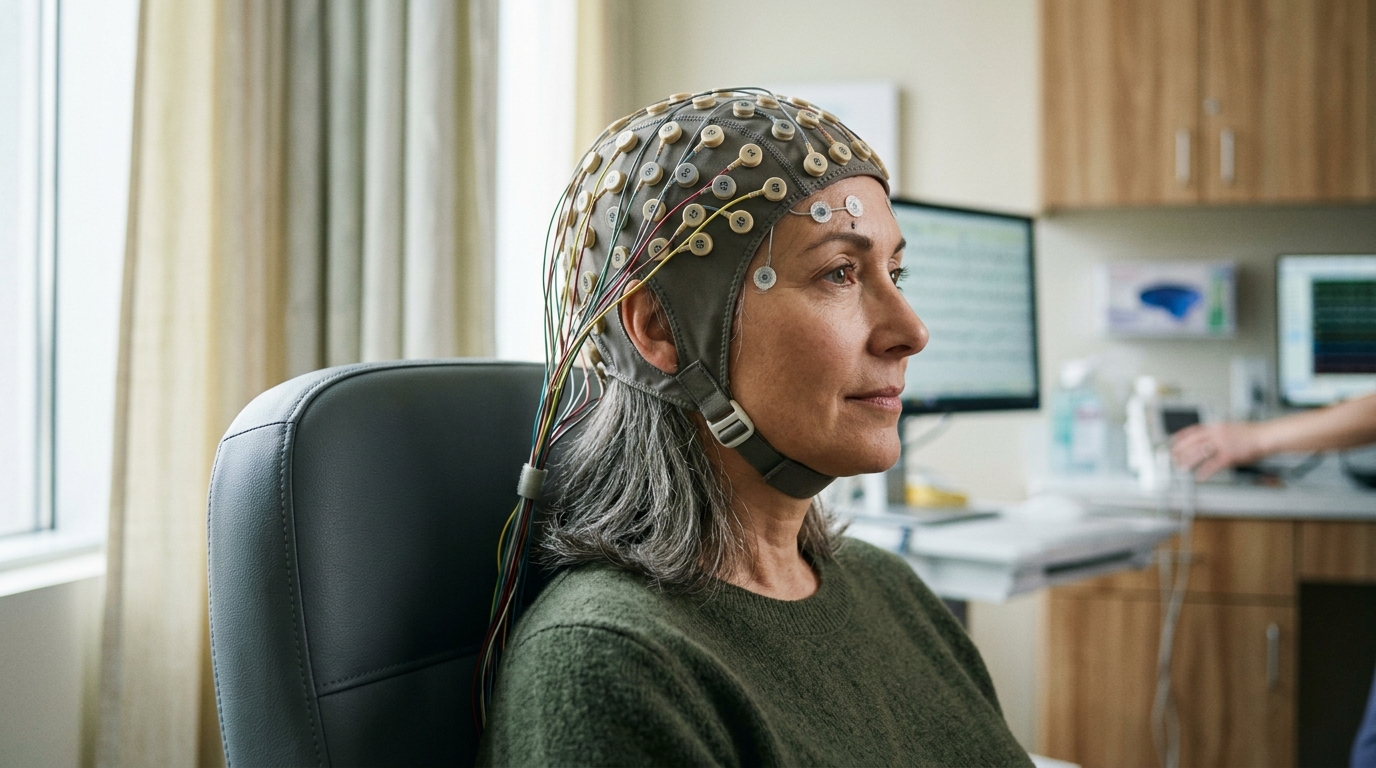
In a resting-state cross-sectional study of 276 untreated adults spanning a wide spectrum of symptom severity, researchers demonstrated that self-reported depressive symptom scores can be predicted by large-scale electroencephalographic phase-resetting dynamics. Rather than relying on isolated cortical regions, the investigators established that depressive symptom severity corresponds to coordinated, network-wide interactions captured by an integrated index of phase-resetting rate modulation. Evaluated across cross-validation frameworks, this neurometric measure achieved a correlation exceeding 0.6 with observed symptom severity scores and discriminated individuals with moderate-to-severe symptoms from those with low symptoms with approximately 80 percent classification accuracy, offering proof of principle for objective severity assessment.
Conventional electroencephalography studies have typically focused on localized metrics, such as frontal alpha asymmetry or relative alpha power, but these approaches have yielded inconsistent findings, remained restricted to basic case-control classifications, or proved difficult to interpret through identifiable neurobiological mechanisms. Moreover, in this cohort, conventional relative alpha power and frontal alpha asymmetry failed to provide meaningful cross-validated predictions of symptom scores. Such limitations suggested to the investigators that depressive symptom severity is not confined to discrete, isolated features in specific brain regions. Instead, symptom-related information appears to be distributed across widely dispersed cortical networks, necessitating analytical methods capable of capturing time-dependent, multi-electrode interactions across distinct oscillatory frequencies.
To quantify these distributed neural interactions, the study introduced a framework termed phase-resetting rate modulation, or PRRM. The investigators identified these events by continuous wavelet transform across the 3 to 44 Hertz range, detecting points marked by local amplitude minima where instantaneous angular velocity deviated from the segment mean by more than five percent of the expected angular velocity. A refractory period of half an oscillatory cycle was imposed to prevent spurious consecutive event detections. PRRM builds directly upon this baseline occurrence rate, known as the phase-resetting rate, by evaluating ordered source-to-target electrode pairs. Specifically, PRRM quantifies how the occurrence of a phase reset at a designated source electrode modulates the subsequent reset rate at a target electrode within an event-locked post-event time window spanning from tau to two tau.
The grand-average PRRM trajectory observed across all study participants exhibited a distinct temporal sequence, initially displaying positive modulation across frequencies before transitioning into a negative trough at intermediate lags, followed by a slight rebound toward baseline. However, raw baseline rates and global modulation levels varied considerably among individuals. To isolate source-specific deviations from each target’s average event-locked modulation, the authors developed relative PRRM, or PRRMrel. This metric subtracts the mean PRRM across all source electrodes for each target, frequency, and lag, canceling out shared baseline activity. The resulting relative metric revealed distinct directional communication patterns across the scalp, such as strong ipsilateral frontal modulation and dense interactions connecting temporal and occipital regions to parietal areas. Importantly, the authors emphasize that while PRRM measures time-lagged statistical correlations across electrode pairs, large values reflect lag-specific associations and do not inherently establish directed biological causality.
The study evaluated a carefully screened cohort of 276 untreated adults, comprising 139 males and 137 females aged between 18 and 59 years, with a mean age of 43.25 years. Candidates were recruited through public advertisements, narrowing down an initial pool of approximately 4,200 applicants to ensure a balanced demographic distribution across sex and depressive symptom severity. All enrolled individuals were medication-free and had remained free from any psychiatric treatment for at least one full year prior to participation. Seven participants reported remote historical psychiatric treatment, but all had been stable and off treatment for more than twelve months. To assess depressive severity, participants completed both the Zung Self-Rating Depression Scale, or SDS, and the Patient Health Questionnaire-9, or PHQ-9. SDS served as the primary instrument because it demonstrated greater score dispersion across the lower severity range, whereas the PHQ-9 exhibited a notable floor effect, with 59 participants scoring zero.
Resting-state electroencephalographic data were acquired using a portable 14-channel wireless system operating at a downsampled rate of 128 Hertz, internally sampled at 2,048 Hertz, across a bandwidth of 0.2 to 45 Hertz. Participants completed four separate two-and-a-half-minute eyes-closed recording sessions, yielding ten minutes of total recording time under quiet resting conditions. Technicians remained blinded to symptom scores, and participant testing order was randomized to prevent temporal bias. The researchers avoided post hoc decomposition methods such as independent component analysis or artifact subspace reconstruction, noting that spatial decomposition remains less validated for sparse 14-channel arrays and could alter the transient amplitude minima essential for phase-reset detection. Instead, rigorous acquisition screening excluded low-contact sessions, retaining valid sessions for analysis.
In exploring candidate predictive features, the researchers examined correlations between relative PRRM values and SDS symptom scores across 182 directed electrode pairs. Permutation testing with 10,000 label shuffles revealed that pairs with significant extremal correlations clustered predominantly within the low-gamma band, spanning 30 to 44 Hertz, and the upper-alpha band, spanning 10 to 13 Hertz, while lower-alpha and beta bands showed no significant extremal pairs. Restricting permutation tests to these candidate frequency bands identified ten pairs showing positive correlations, nine of which originated from source electrodes in the left hemisphere, and three pairs showing negative correlations. Stringent multiple-comparison corrections, such as Bonferroni or false discovery rate adjustments, would have retained only a single electrode pair, P7 to O1. However, the total count of 13 features meeting an uncorrected threshold substantially exceeded chance expectations, demonstrating that symptom severity is reflected diffusely rather than through isolated dominant connections.
Recognizing that individual connections carried weak but genuine predictive signals, the researchers adopted an aggregation strategy to maximize signal-to-noise ratios. Features were z-score standardized and polarity-aligned by multiplying negatively correlated values by negative one, ensuring that every retained feature positively tracked symptom severity. When averaged across the 13 full-sample features, this descriptive integrated index exhibited a strong correlation of 0.726 with SDS scores, remaining robust after controlling for age and participant sex. To visualize how true signal exceeded random noise across varying correlation thresholds, the authors defined a heuristic metric termed weighted net signal. By weighting the net excess of selected features over null expectations by their statistical surprisal, the weighted net signal tracked predictive performance closely. This confirmed that combining multiple weakly correlated features whose average absolute inter-feature correlation was merely 0.064 effectively minimized redundancy while capturing a coherent shared underlying signal.
To validate predictive accuracy without data leakage, the authors implemented nested and stratified k-fold cross-validation. Coordinate-wise nested cross-validation established fixed parameter boundaries, setting the feature-selection threshold at 0.238, the upper-alpha range between 10.5 and 12.5 Hertz, and the low-gamma range between 33 and 44 Hertz. Within each outer cross-validation fold, standardization parameters, feature selection, and linear regression fitting occurred strictly within the training partitions. In a 46-fold evaluation, the model achieved a correlation of 0.620 between predicted and observed SDS scores, accompanied by a mean absolute error of 8.64. When evaluated as a binary classifier excluding the intermediate border group, the model discriminated between high-symptom and low-symptom individuals with 79.1 percent accuracy, demonstrating 76.7 percent sensitivity and 81.6 percent specificity. Performance peaked during leave-one-out cross-validation at 276 folds, attaining a correlation of 0.679, a mean absolute error of 8.02, and an overall classification accuracy of 81.7 percent.
Systematic ablation analyses further highlighted the importance of spectral and anatomical constraints. Removing the left-hemisphere source restriction for positive correlations caused only a modest drop in model accuracy, whereas eliminating the frequency-band restriction produced a substantial decline in predictive capability. Combining the upper-alpha and low-gamma frequency bands delivered the most consistent predictive power, with low-gamma features providing the single largest independent contribution. Conversely, intermediate frequency intervals, including the 8 to 10.5 Hertz and 12.5 to 33 Hertz bands, offered minimal predictive utility. Although exploratory evaluations suggested that frequencies below 8 Hertz and time lags shorter than 75 milliseconds contained some symptom-related information, incorporating them failed to improve the primary model. The authors noted that this frequency-dependent utility reflects the effective signal-to-noise ratio within their recording constraints, rather than an absolute statement regarding the underlying biological distribution of neural oscillations.
Despite the promising results, the authors emphasized several significant methodological and clinical constraints that frame this work as proof of principle rather than a finished clinical diagnostic tool. Depressive severity was quantified exclusively through self-report questionnaires rather than structured clinical diagnostic interviews, meaning the findings do not establish direct associations with clinically diagnosed major depressive disorder. Furthermore, the cross-sectional study design prevents determining whether the integrated index reflects stable trait-like neurophysiology, transient symptom states, or responsiveness to therapeutic intervention over time. Hardware constraints also limited spatial and spectral precision: the 14-channel montage with a 128 Hertz sampling rate restricted the detection of high-frequency gamma dynamics and prevented localization to specific anatomical generators. The authors concluded that independent external validation across clinically characterized patient cohorts, using higher-density and wider-bandwidth recording systems, will be essential to establish the true clinical utility and longitudinal sensitivity of phase-resetting neurometrics.
Subject of Research: Neurometric prediction of depressive symptom severity using electroencephalographic phase-resetting dynamics
Article Title: Distributed EEG phase-resetting dynamics predict depressive symptom severity in untreated adults
Article References: Morita, M., & Konishi, H. (2026). Distributed EEG phase-resetting dynamics predict depressive symptom severity in untreated adults. Nature Mental Health. https://doi.org/10.1038/s44220-026-00757-8
Image Credits: AI Generated
DOI: 10.1038/s44220-026-00757-8
Keywords: Electroencephalography, Depression, Mental Health, Neurometric Markers, Phase Resetting, Neuroscience, Predictive Modeling, Brain Dynamics, Distributed, phase-resetting, dynamics, predict
News Source: Glenn Wilkins. (November 8, 2026). Brainwave Resetting Patterns Predict Depressive Symptom Severity Across Untreated Adults. Scienmag.