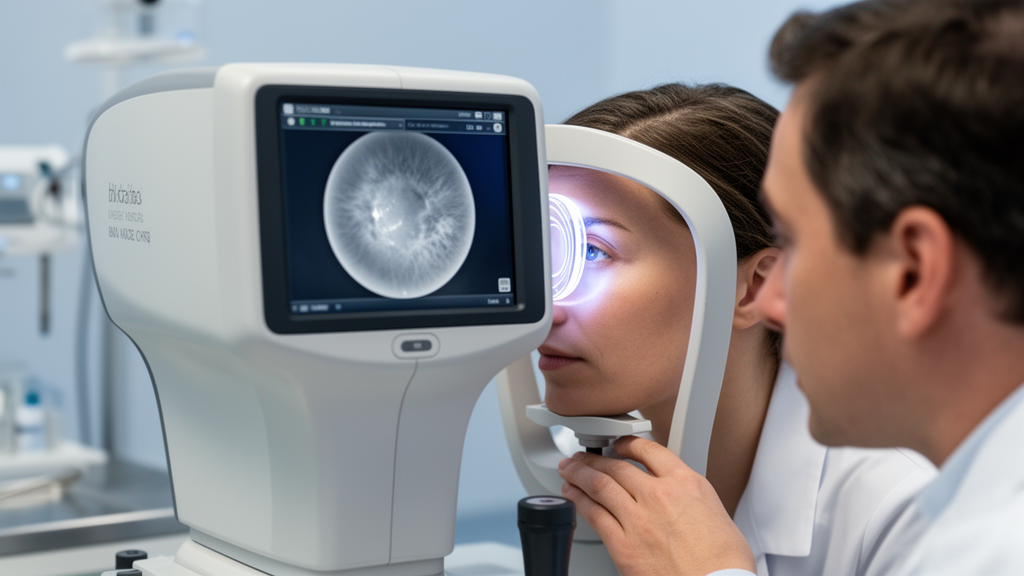
Retroillumination parameters recorded by an autorefractometer demonstrated moderate diagnostic value in patients with cataracts who presented with reduced visual acuity. According to investigators evaluating this imaging approach, the automated opacity indices provide useful supplementary information when evaluating cataract-related visual impairment.
The study was designed to detect cataracts using retroillumination data obtained from an autorefractometer and to compare these measurements across different cataract types. Clinicians evaluated how these objective optical opacity metrics corresponded to visual function and whether they varied across clinical subgroups.
The investigation evaluated 258 eyes from 129 patients diagnosed with cataracts, spanning an age range of 43 to 80 years. To assess diagnostic capability across different degrees of visual impairment, the researchers stratified the cohort into two clinical groups: Group 1 included eyes with a best-corrected visual acuity of 0.5 or lower, while Group 2 included eyes with a best-corrected visual acuity greater than 0.5.
During examinations, the researchers documented cataract type, best-corrected visual acuity, and retroillumination parameters obtained from the autorefractometer. The recorded values comprised central opacity index height, designated as COI. H in millimeters, central opacity index area, designated as COI. A as a percentage, and the peripheral opacity index, designated as POI. The National Eye Institute Visual Function Questionnaire-25 was also administered to evaluate the impact of visual function on quality of life, alongside evaluations of the correlation between questionnaire outcomes and visual acuity.
Comparative analyses demonstrated statistically significant differences between the two visual acuity cohorts across all three retroillumination parameters. Values for central opacity index height in millimeters, central opacity index area percentage, and peripheral opacity index each differed significantly between Group 1 and Group 2, with all p-values below 0.001. In receiver operating characteristic analyses, the area under the curve reached 0.80 for central opacity index height, 0.74 for central opacity index area, and 0.79 for the peripheral opacity index.
When comparing measurements across different cataract types, central opacity index height and central opacity index area differed significantly, both yielding p-values below 0.001. In contrast, the difference in the peripheral opacity index across cataract types was marginal, with a p-value of 0.045. Furthermore, correlation analysis indicated that mean best-corrected visual acuity was negatively correlated with the autorefractometer retroillumination data.
Subject of Research: Diagnostic value of autorefractometer retroillumination data in cataract patients
Article Title: Evaluation of retroillumination data obtained using an autorefractometer in patients with cataracts
Article References: Sönmezoğlu, B. G., Çakır, B., Mutlu, M. N., Akyüz Altun, S. N., & Sönmezoğlu, H. İ. (2026). Evaluation of retroillumination data obtained using an autorefractometer in patients with cataracts. BMC Ophthalmology. https://doi.org/10.1186/s12886-026-05533-x
Image Credits: AI Generated
DOI: 10.1186/s12886-026-05533-x
Keywords: cataracts, autorefractometer, retroillumination data, best-corrected visual acuity, central opacity index height, central opacity index area, peripheral opacity index, COI. H, COI. A, POI, NEI-VFQ-25, National Eye Institute Visual Function Questionnaire-25, visual impairment, ROC analysis, area under the curve, cataract types, visual function, quality of life
News Source: Ophelia Keating. (November 12, 2026). Autorefractometer Retroillumination Data Show Moderate Diagnostic Value in Cataract Evaluation. Scienmag.