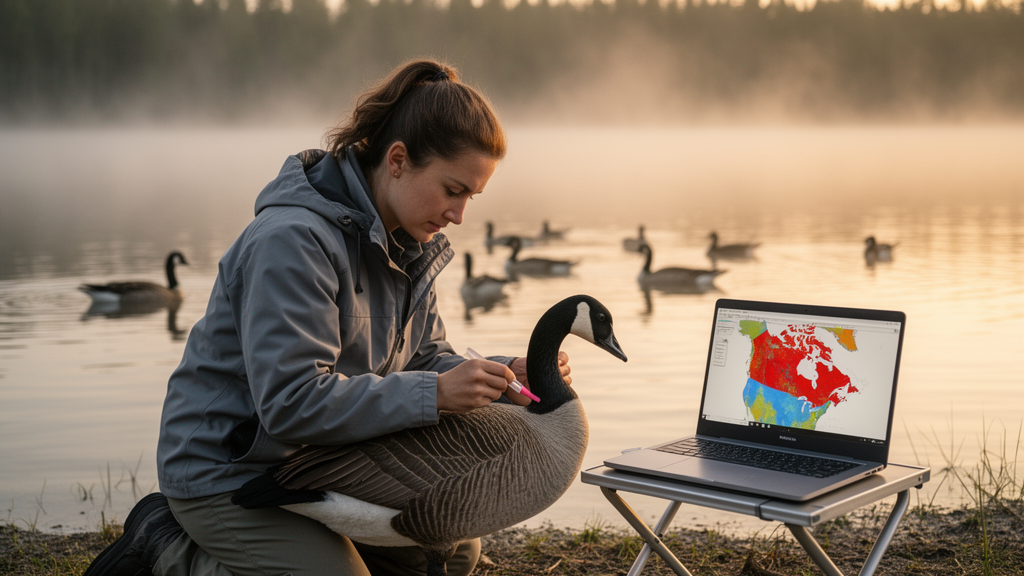
Researchers have built an artificial intelligence system that predicts where highly pathogenic avian influenza outbreaks are likely to occur in Canada up to two weeks before they are reported, using a pretrained vision model that reads raw satellite and environmental maps rather than hand-crafted statistics. The model, called RAVEN, outperformed established machine learning methods on both poultry and wild bird outbreak prediction, according to a study published in the journal Artificial Intelligence in Agriculture.
Since 2022, highly pathogenic avian influenza outbreaks have led to the loss of roughly 184 million birds in the United States, and approximately 17 million birds have been affected in Canada since late 2021. The 2014–2015 epidemic in the United States caused several billion dollars in economic damage, and the virus has increasingly spilled over into mammals, raising concerns about future host adaptation.
Conventional outbreak prediction relies on tabular datasets assembled through manual feature engineering. Satellite imagery, land cover maps and surveillance records are naturally high-resolution rasters, but converting them into tables forces analysts to aggregate the data and decide in advance which environmental variables matter. That process can introduce bias and obscure spatial relationships between neighboring regions. Deep learning on raw raster inputs could, in principle, discover predictive combinations that human-designed features miss, but avian influenza outbreaks are sporadic, leaving few positive samples to train a large neural network from scratch.
RAVEN sidesteps that scarcity problem with transfer learning. The researchers used a Vision Transformer, ViT-B/16, pretrained on ImageNet, as the backbone of the model. Because the pretrained network expects three-channel natural images, the team replaced its input tokenizer with a convolutional tokenizer trained from scratch, which projects each of the many input rasters into a 32-channel feature map. These maps are concatenated and fused with a 1×1 convolution into a 64-channel representation that is then processed by the frozen pretrained encoder. A small classification head with a sigmoid output produces the probability that an outbreak will occur.
The geographic scope is all of Canada. The researchers partitioned the country’s land territory into a fishnet grid of 10-kilometer-by-10-kilometer cells based on the NAD83 coordinate system. Ground truth came from confirmed highly pathogenic avian influenza outbreak reports submitted by the Canadian Food Inspection Agency to the World Animal Health Information System, spanning November 2021 to May 2026. A cell was labeled positive for a given date if at least one confirmed outbreak within it was ongoing or began during the following 30 days. Because surveillance data record only where outbreaks happened, not where they definitively did not, the team generated pseudo-absences: for each positive sample, five negatives were drawn, four from nearby cells on the same date and one from the same cell on an outbreak-free date, excluding periods within 30 days before a known outbreak.
Each input sample is a 224-by-224-pixel raster covering a 50-kilometer-by-50-kilometer area centered on the target cell, so the model sees the cell and its surroundings in every direction. The data layers include five wetland classes from the Canadian Wetland Inventory, eight ERA5 weather variables such as temperature, humidity, precipitation, wind and solar radiation, 27 poultry-related channels from the 2021 Census of Agriculture covering flock sizes, farm counts and production volumes, wild bird observation counts and a high-risk species ratio from eBird, population densities, and historical outbreak layers from WAHIS encoding outbreak presence and recency over windows ranging from 0–30 to 90–180 days. Weather and bird observations were summarized over the previous 7 and 30 days. Domestic and wild bird outbreaks were modeled as separate tasks, though the domestic model also received wild bird outbreak history to capture potential spillover signals.
The results showed a consistent advantage for RAVEN over five baselines: a multilayer perceptron, random forest, RUSBoost, AdaBoost and XGBoost, all of which received the same features in tabular form extracted from the center grid cell. On the domestic bird dataset, RAVEN achieved 89.46 percent accuracy, a recall of 60.79 percent, an F1 score of 64.79 percent, an AUPRC of 63.65 percent and an AUROC of 80.66 percent at the 7-day prediction lag, averaged over 30 runs with different random seeds. At the 14-day lag, the F1 score was 62.85 percent. The best baselines, AdaBoost and RUSBoost, reached F1 scores of about 54 percent, with very high precision but recall of only about 37 percent, meaning they missed substantially more confirmed outbreaks. Differences were statistically significant under the Wilcoxon signed-rank test.
Performance was even stronger for wild bird outbreaks. RAVEN reached 91.3 percent accuracy, 86.43 percent recall, an F1 score of 73.12 percent and an AUROC of 93.23 percent at the 7-day lag, and an F1 score of 63.83 percent at 14 days. The 7-day horizon consistently outperformed the 14-day one, which the authors interpret as evidence that predictive signals emerge close to the outbreak. A qualitative failure analysis showed the trade-offs of spatial integration: the model recovered distributed multi-source risk patterns that tabular models missed, but it sometimes overpredicted in risk-associated landscapes or underpredicted when decisive evidence, such as sparse wild bird signals, was highly localized.
Ablation experiments revealed which data sources carried the predictive weight. For domestic bird outbreaks, static rasters alone yielded an F1 score of only 12 percent, and adding weather or wild bird observations brought little improvement. The decisive gain came from adding WAHIS historical outbreak layers, which lifted the all-source configuration to 89 percent accuracy, 68 percent precision, 58 percent recall and 62 percent AUPRC. A reverse ablation starting from outbreak history showed that wild bird observations and static rasters still added information: combining WAHIS history, wild bird observations and static layers while excluding weather produced the best domestic AUPRC of 68.80 percent, about 3.6 percentage points above history alone. For wild birds, WAHIS history alone already achieved an F1 score of 73.00 percent and an AUROC of 95.45 percent, and adding static rasters raised the F1 score to 76.00 percent. Gradient-based importance analysis indicated that recent outbreak presence channels, wetland water and fen classes, humidity, wind, precipitation, solar radiation, poultry production types including duck, turkey and broiler channels, and 30-day wild bird observation counts were among the strongest contributors, though the authors stress these are model-level associations, not causal evidence.
The authors acknowledge several limitations. Wildlife outbreak reporting is sparse and uneven, so pseudo-absences may not represent real-world absence conditions. The model uses snapshot environmental inputs rather than continuous temporal sequences, which may limit sensitivity to transient weather events and migratory waves. Neighboring raster windows may share spatial information across the chronological train-validation-test split, and spatially blocked validation would provide a stricter test of geographic generalization. Generalizability to other regions remains untested, and interpretability methods do not establish causal relationships. Future work, the team writes, should incorporate recurrent temporal modeling, migratory pathway and livestock transport data, improved pseudo-absence sampling, and region-specific adaptation. Even so, the study demonstrates that foundation-model approaches can extract usable early-warning signals from limited, imbalanced surveillance data, suggesting a path toward operational AI systems that help prioritize surveillance resources and preventive action before avian influenza outbreaks escalate.
Subject of Research: Deep learning prediction of avian influenza outbreak risk in Canada using multi-source geospatial raster data
Article Title: RAVEN: a foundation model-based approach for predicting avian influenza outbreak risk with multi-source geospatial data
Article References: Soltani, M., Vergne, T., Farimani, M. K., Berke, O., Sharif, S., & Dara, R. (2026). RAVEN: a foundation model-based approach for predicting avian influenza outbreak risk with multi-source geospatial data. Artificial Intelligence in Agriculture. https://doi.org/10.1016/j.aiia.2026.10.003
Image Credits: AI Generated
DOI: 10.1016/j.aiia.2026.10.003
Keywords: avian influenza, HPAI, outbreak prediction, foundation model, Vision Transformer, deep learning, Canada, geospatial data, disease surveillance, wild birds, poultry, early warning systems
News Source: Blake Davidson. (October 29, 2026). AI Model Forecasts Avian Influenza Outbreak Risk Across Canada. Scienmag.