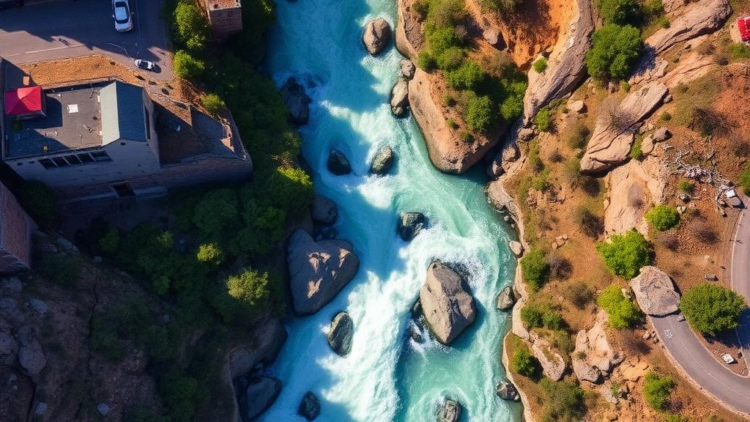
On a scorching summer weekend along Idaho’s Payette River, the parking lots at Banks and Beehive Bend fill within hours, spillover cars line the highway shoulders, and the water itself churns with rafts and kayaks. For decades, managers of this world-famous whitewater corridor have known that demand outstrips the physical space available for staging a river trip, but they have lacked the data to prove it, quantify it, or track it over time. A new study published in Machine Learning with Applications by Jordan W. Smith and Chase C. Lamborn demonstrates a way to change that, using computer vision to turn ordinary aerial photographs and trail cameras into a continuous, corridor-wide measurement system for recreation capacity.
The research tackles a stubborn bottleneck in outdoor recreation management: the concept of carrying capacity has evolved well beyond the search for a single maximum number of visitors. Modern practice, codified in the Interagency Visitor Use Management Framework, asks managers to define desired conditions, select measurable indicators, set thresholds, and link monitoring to adaptive actions. Yet implementation routinely stalls at the measurement step. Manual counts are expensive, automated counters suffer from group undercounting and false triggers, and neither approach tells managers where vehicles can plausibly park, when parking fills, or how use concentrates along a linear corridor that may stretch for many kilometers. The Payette River, with its fragmented jurisdiction spanning the USDA Forest Service, the Bureau of Land Management, state transportation agencies, and local law enforcement, exemplifies the problem.
The authors built two complementary workflows. The first quantifies what they call parking opportunity, the spatial extent of surfaces where a vehicle could realistically be parked, using high-resolution aerial imagery from the National Agriculture Imagery Program at 0.6-meter resolution. The analysis area was defined by intersecting 500-meter buffers around major highways and the river itself, then constrained to terrain with slopes of five percent or less using a one-meter digital elevation model from the USGS 3DEP program. This slope filter was applied twice, first to screen candidate training labels and again to mask out implausible predictions on steep hillsides during inference, ensuring the model never reports parkable surface on a cliff face.
Label development for the segmentation workflow relied on the Segment Anything Model, or SAM, in its largest ViT-H configuration. SAM generated 12,942 candidate object proposals from the tiled aerial imagery, but manual review revealed that most of these were trees, a striking illustration of why general-purpose foundation models still require human curation when applied to infrastructure mapping. After screening, 817 polygons survived with meaningful labels, of which only 16 represented paved parking and 50 represented dirt or gravel parking. This severe scarcity of positive examples shaped the modeling strategy: the team trained a DeepLabV3+ network with a ResNet-34 encoder using a weighted multi-class cross-entropy loss that penalized parking misclassification heavily, and applied on-the-fly augmentations including flips, rotations, affine transforms, and brightness perturbations to squeeze more effective diversity from the sparse labels.
The final segmentation model achieved a mean intersection-over-union of 0.64 across classes, with 0.60 for paved parking and 0.56 for dirt and gravel parking, substantially better than an unweighted, non-augmented baseline. Post-hoc checks found that fewer than five percent of model-derived paved parking areas fell within four meters of roadway centerlines, suggesting that confusion between roads and parking lots, the error mode with the greatest practical consequence, was marginal in this setting. The resulting maps revealed that parking opportunity is highly uneven along the corridor, giving managers a replicable, spatially explicit supply-side baseline for the first time. The authors are careful to note that mapped opportunity is not the same as authorized or safe parking, and that field verification of ownership, legality, and stall geometry remains essential before any investment decisions.
The second workflow addresses the demand side, using YOLO26 object detection applied to a large corpus of images from motion-triggered cameras positioned at parking areas and river viewpoints. Rather than labeling images at random, the team employed an active learning strategy: a COCO-pretrained baseline detector produced preliminary detections, and an uncertainty- and diversity-aware selector chose an initial batch of 500 images for human annotation, prioritizing ambiguous predictions, hard negatives likely to cause false positives, and predicted-empty images to stabilize specificity. A second loop of 1,000 river-only images specialized the detector for the notoriously difficult visual conditions of water scenes, where glare, specular highlights, partial occlusion, and clustered watercraft confound naive models. Two annotators achieved inter-annotator agreement above 0.80 on Krippendorff’s alpha, following strict rules such as labeling only the visible portion of occluded vehicles and refusing to label reflections or wake patterns as boats.
Watercraft remained so rare in the imagery that the workflow added a targeted mining phase. The team calibrated a confidence threshold by sweeping candidate values against validation data, then ran large-scale inference across the full river corpus, ranking images by a mining score that favored confident, meaningful detections. High-ranked candidates were annotated and oversampled during a final fine-tuning stage, with mined examples strictly restricted to the training pool to avoid evaluation leakage. The payoff was dramatic: watercraft recall increased substantially in the final iteration alongside precision of 0.843, lifting mean average precision at the 0.50 threshold to 0.554. Vehicle detection, by contrast, was strong throughout, reaching precision of 0.856, recall of 0.733, and mAP50 of 0.865 in the final model, supporting the use of vehicle counts as a reliable comparative indicator of access pressure.
Aggregated results paint a vivid picture of corridor dynamics. Parking occupancy proxies showed sharp within-day pulses aligned with arrival and departure cycles, with the highest demand at Banks and Beehive Bend concentrated on weekends and midday, while sites such as Alder Creek, Danskin, and Deadwood showed much smaller peaks. On the river, watercraft detections clustered into two pronounced windows, mid-morning and mid-afternoon, with the Banks-to-Beehive stretch showing the most intense activity, consistent with typical launch-to-takeout travel times. Calibration against 67 hours of manual hand-tally counts yielded only modest absolute agreement, with a correlation of 0.35 and an R-squared of 0.12, but crucially the temporal ordering of peak-use windows and the relative ranking of sites remained stable between calibrated and uncalibrated series. The authors therefore recommend treating the on-river metric as a relative activity indicator rather than an absolute census of boats.
The study’s broader significance lies in its honesty about what machine learning can and cannot deliver for public land management. The authors explicitly frame their outputs as physical infrastructure and demand indicators, necessary inputs to capacity frameworks but not capacity thresholds themselves, since acceptable levels of crowding and ecological impact require social and ecological standards that no camera can supply. They also confront the ethics of camera deployment in public spaces, recommending placement that avoids capturing faces, resolution limited to detection needs, masking of sensitive regions, signage, and aggressive data retention policies that discard raw imagery once detections are extracted. Post-hoc benchmarks showed DeepLabV3+ outperforming U-Net and FPN architectures for segmentation, while the compact YOLO26n variant, at just 2.5 million parameters versus 32.1 million for an FCOS comparison, delivered comparable vehicle detection, an operational advantage for resource-constrained agencies.
For a field where monitoring capacity has long been the weakest link in adaptive management, the Payette River case offers a template that could extend to trail networks, scenic byways, and other linear recreation corridors wherever aerial imagery and fixed cameras are feasible. The workflow’s active learning strategy, in which a modest amount of targeted annotation informed by uncertainty and hard-example mining yields outsized gains on rare but management-critical targets, transfers naturally to other sparse-event monitoring problems. The authors caution that generalization beyond a single corridor remains a working hypothesis, and that seasonal domain shift, changing vegetation, and camera mounting constraints will demand local recalibration. But the core message is clear and timely: with careful human-in-the-loop design, transparent error accounting, and explicit acknowledgment of uncertainty, computer vision can finally give recreation managers the continuous, spatially explicit evidence they need to diagnose bottlenecks before they become conflicts.
Subject of Research: Computer vision workflows for measuring parking capacity and recreation demand along a linear river recreation corridor
Article Title: Computer vision workflows for physical carrying capacity analysis and monitoring in linear recreation corridors
Article References: Smith, J. W., & Lamborn, C. C. (2026). Computer vision workflows for physical carrying capacity analysis and monitoring in linear recreation corridors. Machine Learning with Applications, 26, Article 101012. https://doi.org/10.1016/j.mlwa.2026.101012
Image Credits: AI Generated
DOI: 10.1016/j.mlwa.2026.101012
Keywords: computer vision, carrying capacity, outdoor recreation, semantic segmentation, object detection, YOLO, Segment Anything Model, DeepLabV3+, active learning, Payette River, visitor monitoring, machine learning
Cite Scienmag News
APA MLA Chicago
Blake Davidson. (October 2, 2026). AI Cameras and Aerial Imagery Map the True Limits of a Famous Whitewater Corridor. Scienmag. https://scienmag.com/ai-cameras-and-aerial-imagery-map-the-true-limits-of-a-famous-whitewater-corridor/
Blake Davidson. “AI Cameras and Aerial Imagery Map the True Limits of a Famous Whitewater Corridor.” Scienmag, 2 October 2026, https://scienmag.com/ai-cameras-and-aerial-imagery-map-the-true-limits-of-a-famous-whitewater-corridor/. Accessed 2 October 2026.
Blake Davidson. “AI Cameras and Aerial Imagery Map the True Limits of a Famous Whitewater Corridor.” Scienmag. October 2, 2026. https://scienmag.com/ai-cameras-and-aerial-imagery-map-the-true-limits-of-a-famous-whitewater-corridor/
Copy citation Download RIS
Tags: active learningadaptive management of popular outdoor recreation sitesaerial imagery analysis for outdoor recreationautomated counting technologies for outdoor activitiescapacity planning for high-demand outdoor recreation areascarrying capacitycomputer visioncomputer vision for environmental monitoringDeepLabV3+drone and trail camera data analysisMachine learningmachine learning applications in outdoor recreationobject detectionoutdoor recreationoutdoor recreation environmental impactPayette Riverriver corridor capacity assessmentSegment Anything Modelsemantic segmentationspatial analysis of whitewater river demandvisitor monitoringvisitor use management frameworksWhitewater recreation managementYOLO