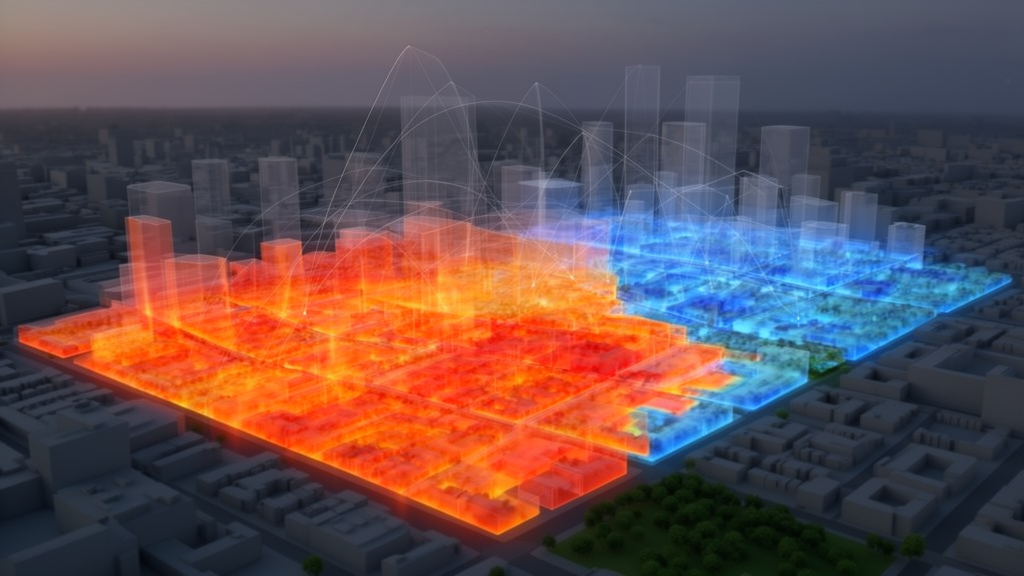
Researchers investigating urban microclimates have established an explainable artificial intelligence framework to identify critical predictive thresholds and marginal benefit boundaries that govern land surface temperatures across complex metropolitan environments. Focusing on Shijiazhuang, a densely populated city located within northern China’s Beijing-Tianjin-Hebei agglomeration, the empirical study evaluated how two-dimensional surface cover, three-dimensional architectural morphology, and socioeconomic activity collectively shape urban heat island patterns. Published in Computational Urban Science, the investigation integrated multi-source geospatial data spanning 2020 through 2022 to construct a high-resolution random forest regression pipeline paired with post-hoc interpretability algorithms. Rather than relying on traditional linear correlations or subjective visual inspection of machine learning outputs, the research team deployed a mathematical first-derivative inflection point technique to extract objective governance thresholds. The resulting quantitative model demonstrated that structural sky exposure serves as the most temporally consistent temperature predictor across diurnal cycles, while specific mathematical boundaries in building density, vehicular movement, and green canopy coverage dictate the efficiency of urban heat mitigation initiatives.
The study was motivated by accelerating global urbanization and the corresponding expansion of impermeable built surfaces, which disrupt terrestrial energy balances by modifying surface albedo, thermal storage capacity, and latent heat fluxes. Although conventional remote sensing analyses have consistently recorded statistical links between vegetation loss and elevated urban surface temperatures, traditional linear regressions fail to capture the complex, non-linear interactions characteristic of real-world urban canopy layers. Concurrently, while modern machine learning algorithms achieve high predictive accuracy, their internal mechanisms often operate as inaccessible black boxes that do not yield actionable, threshold-based metrics for urban planners. To bridge this gap between predictive modeling and municipal design, the investigators collected remote sensing imagery from ECOSTRESS, Sentinel-2, and Landsat 8 and 9 platforms alongside vector building footprints from the 3D-GloBFP Asia database, OpenStreetMap records, and street-level sky view factor calculations. These physical variables were combined with mobile signaling traffic counts, kernel-density-interpolated point-of-interest registers, and nighttime light observations from the NPP-VIIRS satellite constellation.
Before constructing the predictive architecture, the authors conducted thorough multicollinearity diagnostics to ensure statistical independence across the compiled parameters. Independent variables exhibiting variance inflation factor values above ten, specifically the normalized difference built-up index with a score of 12.37 and mean building mass volume with a score of 14.62, were removed from the modeling pipeline. The remaining environmental predictors demonstrated variance inflation values ranging between 1.23 and 4.87, confirming statistical suitability. The analytical framework evaluated land surface temperatures across 1,060 standardized observational units under two separate spatial scales, comparing a thirty-meter basic grid with a five-hundred-meter urban block grid. Spatial consistency was further corroborated by assessing land cover stability across the four core urban districts of Chang’an, Qiaoxi, Xinhua, and Yuhua, where annual fluctuations in built-up area and vegetative cover remained below 2.1 percent and 1.7 percent, respectively. The dependent variables were evaluated across early morning, midday, and late evening satellite capture windows to observe daily thermal fluctuations during peak summer months.
To overcome spatial autocorrelation and avoid overestimating model performance, the researchers executed five-fold spatial block cross-validation by dividing the urban core into distinct five-hundred-meter quadrats, verifying residual independence with Moran’s I statistic. The random forest regression model was optimized using grid search cross-validation, settling on three hundred decision trees, a maximum depth of ten, a minimum split requirement of five samples, and three candidate features per tree partition. Spatial cross-validation test coefficients of determination spanned from 0.512 to 0.582, while random split evaluations yielded test values between 0.544 and 0.640. Prediction accuracy peaked during early morning conditions at 07:20, achieving a test coefficient of determination of 0.640 and a root mean squared error of 0.55 degrees Celsius, aided by a stable atmospheric boundary layer and accumulated surface thermal inertia. Midday modeling at 11:51 registered lower predictive accuracy with an error of 2.40 degrees Celsius, reflecting dynamic solar irradiance, localized wind turbulence, and peak anthropogenic emissions, whereas nocturnal evaluations at 22:23 attained a determination coefficient of 0.623 and an error of 1.12 degrees Celsius.
Global permutation feature importance assessments revealed that three-dimensional urban morphology indicators represented the primary predictive category, accounting for 41.2 percent of aggregate importance across the modeled periods. Two-dimensional land surface parameters constituted 32.7 percent of relative importance, while dynamic socioeconomic indicators accounted for the remaining 26.1 percent. Sky view factor emerged as the single most robust predictive metric, contributing 22.7 percent of total importance alongside its derived quadratic formulation during the early morning period. The predictive hierarchy also displayed distinct diurnal complementary behaviors. Midday thermal profiles were predominantly governed by vegetative indices, where enhanced vegetation index and normalized difference vegetation index reached a collective importance contribution of 47.3 percent at noon, highlighting the dominant influence of daytime evapotranspiration. Conversely, three-dimensional geometry took precedence at night, accounting for 51.6 percent of predictive importance compared to 28.7 percent for vegetative indices, as dense urban street canyons effectively restricted the outward escape of nocturnal longwave radiation.
Thermal distributions differed significantly across urban functional zones, as confirmed by one-way analysis of variance across commercial, industrial, residential, and administrative categories. Commercial zones experienced the most intense midday land surface temperatures, averaging 28.9 degrees Celsius, with traffic flow, commercial activity density, and impervious surface coverage functioning as primary predictive drivers. Industrial sectors recorded the highest nighttime heat retention, averaging 23.8 degrees Celsius, where elevated building density, nocturnal lighting, and reduced sky exposure prevented nocturnal surface cooling. Pairwise Tukey tests showed that industrial nighttime surface temperatures exceeded peripheral ecological conservation spaces by 2.1 degrees Celsius, while commercial noon temperatures surpassed baseline green spaces by 3.2 degrees Celsius. Residential and administrative districts exhibited intermediate thermal profiles governed by a synergistic balance between building heights, sky exposure, and vegetation cover, underscoring how divergent urban functions require customized cooling interventions.
By coupling partial dependence plots with individual conditional expectation profiles, the investigators derived objective mathematical inflection points representing marginal benefit boundaries for environmental variables. The analysis identified an exact building density predictive threshold of 0.270, supported by a ninety-five percent confidence interval spanning from 0.253 to 0.289. Below this critical structural boundary, every 0.1 increment in the sky view factor was linked to an average surface temperature reduction of 0.32 degrees Celsius. Once building density surpassed 0.270, the associated cooling magnitude amplified dramatically to 0.87 degrees Celsius for every 0.1 gain in sky exposure. The H-statistic confirmed a strong interaction between building density and sky view factor, explaining 18.7 percent of the variance in land surface temperature predictions. The optimal marginal benefit boundary for sky view factor intervention was situated between 0.5 and 0.7, yielding an average surface temperature reduction of 0.74 degrees Celsius per 0.1 increase in open sky geometry.
Vegetation indices displayed pronounced non-linear thresholds characterized by a diminishing marginal return pattern. Partial dependence modeling revealed that the enhanced vegetation index exhibited a sigmoid relationship with surface temperatures, where cooling efficiency was 3.2 times stronger during daylight hours than at night, and 2.1 times more prominent in residential settings than in heavy industrial tracts. The upper predictive threshold for the enhanced vegetation index was quantified at 0.38, with the primary marginal benefit boundary spanning between 0.25 and 0.38. Within this responsive interval, every 0.01 increment in the vegetation index was associated with a 0.40 degree Celsius drop in midday land surface temperature. Once vegetation index values exceeded 0.38, the marginal cooling return fell sharply below 0.10 degrees Celsius per 0.01-unit increase, demonstrating that uncoordinated vegetative greening past specific canopy densities provides diminishing cooling utility under limited municipal budgets.
The research also unveiled substantial non-linear leverage effects generated by vehicular traffic and commercial vitality. Modeling identified an operational vehicular tipping point of approximately 2,800 vehicles per hour, bounded by a ninety-five percent confidence interval from 2,612 to 2,945 vehicles per hour. Beyond this traffic threshold, the marginal heating rate accelerated by 2.35 times, rising from an increase of 0.17 degrees Celsius to 0.40 degrees Celsius per additional one hundred vehicles per hour during midday periods. This acceleration stems from concentrated exhaust heat, re-radiated road surface heat, and restricted canyon dispersion. Concurrently, commercial foot-traffic intensity exhibited a non-linear drop of more than forty percent once standardized land surface temperatures exceeded 0.72. This steep decline establishes an empirical upper comfort threshold for outdoor economic vitality, indicating that extreme microclimatic warming actively undermines pedestrian presence and municipal commercial engagement.
Model robustness was confirmed through multiscale consistency assessments and Monte Carlo resampling simulations. Comparing the primary thirty-meter resolution against the five-hundred-meter block scale revealed that essential predictive variables remained consistently within the top five rankings, while numerical threshold estimates varied by less than five percent with no statistically significant differences in paired testing. Repeated random forest retraining across one hundred alternative seed iterations showed low coefficients of variation, measuring 3.7 percent for building density, 4.2 percent for traffic volume, and 3.1 percent for vegetation indices. Furthermore, systematic perturbation of grid-search parameters across broad decision tree intervals confirmed that all derived threshold values remained well within their original empirical confidence intervals, verifying that the mathematical inflection points reflect stable underlying spatial associations rather than statistical anomalies.
The study authors emphasized several analytical limitations, noting that their empirical findings derive from a single temperate monsoon climate during peak summer months and require multi-seasonal validation before direct application to arid or tropical regions. The random forest models accounted for up to 58.2 percent of temperature variance, leaving remaining fluctuations attributable to unmeasured fine-scale wind fields, surface material heat capacities, and indoor air conditioning exhaust. The researchers cautioned that their statistical predictive thresholds must not be mistaken for absolute physical tipping points or mandatory planning mandates without local engineering assessments. Nevertheless, by demonstrating how explainable machine learning converts complex predictive surfaces into quantifiable marginal boundaries, the study provides a replicable computational framework for prioritizing urban climate interventions under strict municipal fiscal constraints.
Subject of Research: Explainable artificial intelligence modeling of urban heat island predictive thresholds and marginal benefit boundaries
Article Title: Identifying predictive thresholds and marginal benefit boundaries of urban heat environments via explainable AI
Article References: Ding, Q., Ye, W., Shao, Z., & Wang, H. (2026). Identifying predictive thresholds and marginal benefit boundaries of urban heat environments via explainable AI. Computational Urban Science, 6(1), Article 43. https://doi.org/10.1007/s43762-026-00275-4
Image Credits: AI Generated
DOI: 10.1007/s43762-026-00275-4
Keywords: urban heat island, explainable AI, random forest, land surface temperature, urban morphology, sky view factor, building density, traffic emissions, computational urban science, climate adaptation, Identifying, predictive
News Source: Blake Davidson. (November 7, 2026). Explainable Machine Learning Identifies Predictive Thresholds Governing Urban Heat Island Dynamics. Scienmag.