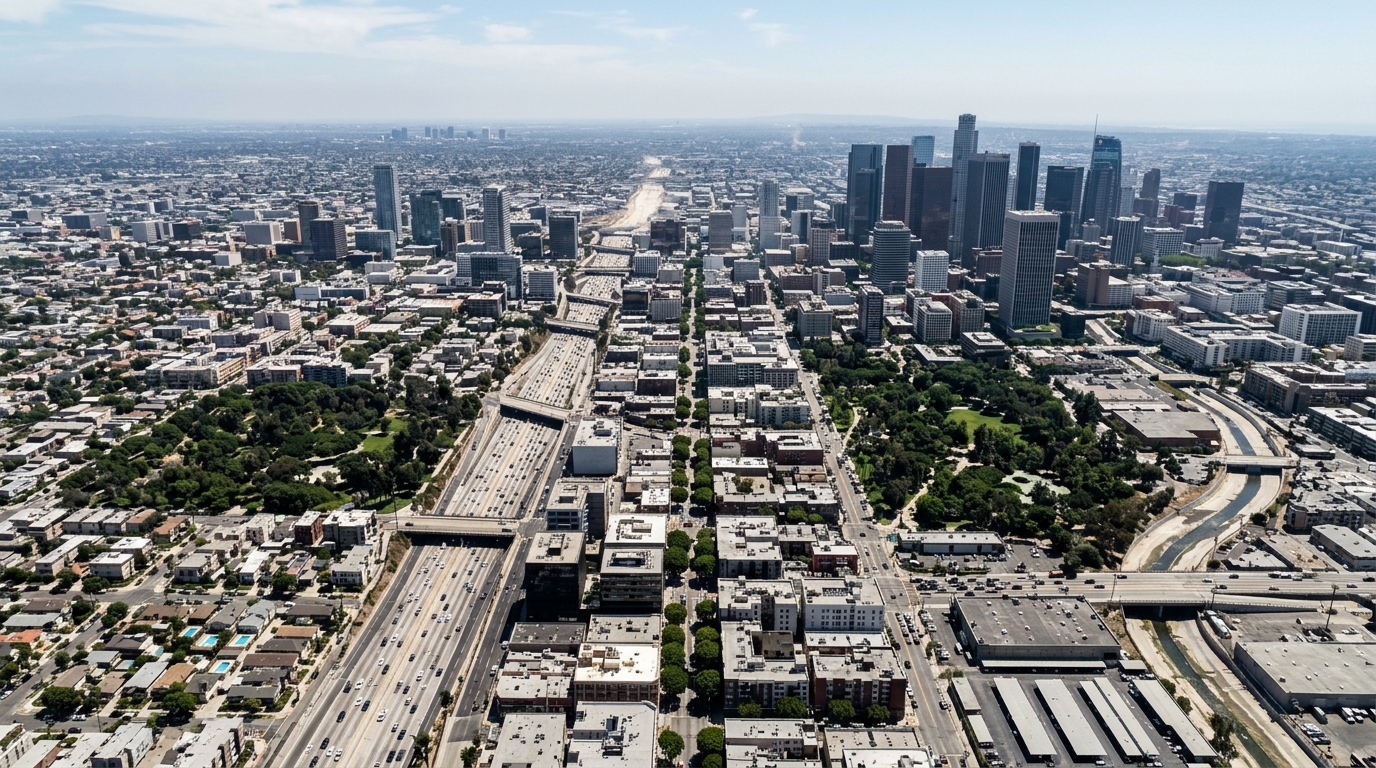
A research team has demonstrated an unsupervised machine learning pipeline capable of classifying complex urban thermal environments directly from high-resolution microclimatic time series, completing the autonomous mapping of an entire metropolitan district in less than thirty seconds. Published in Computational Urban Science by researchers Michele Baia, Carla Balocco, and Franco Bagnoli, the study presents an automated, data-driven framework designed to bridge the operational divide between high-fidelity microclimate simulations and practical urban design. By evaluating continuous temporal trajectories of pedestrian-level Mean Radiant Temperature across an expanded 5.5-square-kilometer sector of Florence, Italy, the authors established that standard variance-minimization algorithms applied to raw temporal data outperform both traditional deterministic rules and specialized shape-matching techniques. The resulting framework processes over four million continuous temporal records without requiring human-guided dimensionality reduction, autonomously identifying distinct thermodynamic regimes that govern how heat accumulates and dissipates across diverse architectural fabrics.
Understanding outdoor thermal comfort in dense urban landscapes requires tracking Mean Radiant Temperature, recognized across environmental biometeorology as the primary parameter governing radiative heat exchange with the human body. This variable directly drives recognized thermo-physiological comfort indices, including the Universal Thermal Climate Index, the Physiological Equivalent Temperature, and the outdoor Predicted Mean Vote, making accurate spatio-temporal radiant temperature assessments vital for diagnosing urban heat islands and associated health risks. Traditionally, microclimatic assessments have relied on computational fluid dynamics or decoupled ray-tracing models like SOLWEIG to estimate three-dimensional radiative flux distributions. While standard fluid dynamics packages compute detailed velocity and temperature fields, their computational overhead becomes prohibitive when extended to multi-day simulations over continuous municipal domains. Decoupled radiative tools accelerate these assessments but remain computationally burdensome when calculating view factors and iterative ray-tracing over millions of computational nodes, limiting their practical deployment during rapid urban design workflows.
To overcome these computational bottlenecks, the investigators generated their foundational microclimatic dataset using the Lean Urban Comfort Intelligent Digital Twin, an ultrafast physical modeling platform that decouples intensive ray-tracing processes. LUCIDiT simplifies surface energy balances by parameterizing transient heat storage through an Exponential Moving Average recursive filter, allowing the model to emulate thermal inertia and nocturnal re-radiation while decreasing calculation times by orders of magnitude compared to traditional fluid dynamics. Furthermore, vegetative cooling is integrated via the Penman-Monteith formulation to compute latent heat fluxes directly from atmospheric forcing, treating trees as a natural system rather than simple geometric shading obstructions. The simulation mapped a 5.5-square-kilometer area in north-western Florence discretized into a continuous one-meter grid, combining OpenStreetMap footprint geometries with Digital Surface Models. Driven by a 2023 Typical Weather Year dataset, the model evaluated a five-day summer interval from August 10 to August 14, discarding the first twenty-four hours to stabilize thermal inertia calculations and yielding a 96-hour continuous time series for each of the four million pixels.
Despite the speed of modern digital twins, interpreting high-resolution microclimatic outputs presents a severe operational obstacle for municipal authorities and non-expert stakeholders. Translating multi-day space-time datasets encompassing millions of spatial cells into actionable planning decisions often overwhelms conventional visualization workflows. Commercial simulation post-processors commonly display static hourly snapshots or animated heat maps, requiring practitioners to manually inspect up to ninety-six discrete frames for a single four-day evaluation period. Conventional data reduction shortcuts, such as calculating daily mean values or mapping absolute maximum temperatures, obscure critical temporal dynamics like directional solar exposure and cooling lags. Similarly, static morphological indicators such as the Sky View Factor or satellite-derived two-dimensional Land Surface Temperature maps suffer from structural orientation blindness, failing to distinguish between morning and afternoon radiant loading or lacking the fine vertical resolution necessary to represent three-dimensional street canyons.
To establish a rigorous methodological benchmark, the authors formulated a deterministic heuristic framework grounded in classical thermodynamic indicators. This rule-based baseline evaluated two primary indices extracted from each pixel: the Global Thermal Range, representing the total amplitude of the daily thermal wave, and the Thermal Asymmetry Index, measuring the difference between afternoon and morning average radiant temperatures under clear-sky conditions. Pixels exhibiting a thermal range below the 25th percentile were classified as shaded or vegetated zones. For remaining areas, an asymmetry threshold of plus or minus two degrees Celsius separated East-facing surfaces, West-facing surfaces, and symmetric open spaces. Although this heuristic decision tree executed rapidly in approximately 5.4 seconds, its rigid global thresholds created extensive classification artifacts in transition zones, generating unnatural salt-and-pepper noise along canyon edges where subtle, continuous microclimatic gradients were split arbitrarily into conflicting categories.
Seeking a mathematically resilient alternative to rigid cutoffs, the researchers compared three unsupervised machine learning configurations: a shape-based clustering pipeline using the K-Shape algorithm on normalized time series, a K-Means pipeline operating on nine engineered scalar features, and a K-Means pipeline applied directly to unstandardized, raw continuous series. K-Shape relied on cross-correlation distance metrics to cluster normalized profiles according to geometric wave morphology. However, its shift-invariant mechanism required fitting on a downsampled subset of 100,000 pixels, requiring approximately fifteen minutes to run while intentionally aligning morning and afternoon thermal peaks to maximize shape similarity. This temporal alignment stripped away the real-world timing of solar irradiation, conflating opposing canyon orientations. Meanwhile, K-Means trained on nine engineered features, including thermal centroids, skewness, and heating gradients, required 73.8 seconds but produced high intra-cluster dispersion, indicating that reducing 96 continuous hourly values into discrete summary features sacrificed vital temporal details.
In contrast, executing the K-Means algorithm directly on raw, unscaled 96-hour continuous sequences emerged as the optimal classification strategy across mathematical and computational benchmarks. Completing the district-wide classification in 24.1 seconds on standard personal computing hardware, this approach preserved the exact temporal synchronization of radiant peaks because the Euclidean distance metric assesses point-to-point differences across identical chronological steps. Leaving temperatures in their native degrees Celsius forced the algorithm to simultaneously evaluate directional phase timing and absolute thermal amplitudes, avoiding the distortions caused by standard normalization. Internal statistical validation confirmed this superiority: raw K-Means achieved the highest Silhouette Score at 0.27 and the lowest Davies-Bouldin Index at 1.47. While mathematical hyperparameter optimization pointed to a binary cluster split (k equals 2) separating open areas from shaded zones, the authors selected a local optimum of four clusters (k equals 4) to capture the crucial secondary variance governed by street canyon orientations.
The physical validity of the four autonomously extracted archetypes was demonstrated by projecting cluster outputs onto a novel two-dimensional Thermal Phase Space, defined by the Global Thermal Range on the vertical axis and the Thermal Asymmetry Index on the horizontal axis. Without receiving any geometric coordinates, physical boundaries, or predefined labels, the unsupervised algorithm cleanly segregated the urban environment into four thermodynamically distinct quadrants. Cluster 0 isolated fully open surfaces exhibiting the highest diurnal thermal amplitude, with a mean thermal range of approximately 52.8 degrees Celsius and negligible asymmetry. Cluster 1 captured West-exposed spaces characterized by strong positive asymmetry averaging positive 8.1 degrees Celsius, reflecting delayed afternoon solar peaks compounded by accumulated air temperatures. Cluster 2 isolated East-exposed surfaces displaying strong negative asymmetry averaging negative 10.2 degrees Celsius from morning solar absorption, while Cluster 3 encompassed persistently shaded environments and dense vegetation, exhibiting a heavily dampened thermal range averaging 39.5 degrees Celsius.
To verify that these data-driven thermodynamic clusters reflected physical reality, the authors cross-referenced each category against three-dimensional urban morphology using spatial View Factors. Cluster 0 correlated strongly with dominant Sky View Factors, physically validating its unhindered celestial exposure and high diurnal amplitude. Clusters 1 and 2 displayed high Wall View Factors, confirming their placement along vertical building facades and narrow street canyons where microclimatic differentiation is driven by solar azimuth rather than enclosure. Cluster 3 corresponded with minimal sky exposure and the highest combined wall and vegetation view factors. To render these findings operationally valuable for municipal planners, the authors established a dual-layer visualization framework linking cluster identities to an absolute heat stress threshold of 40 degrees Celsius Mean Radiant Temperature, representing the physiological onset of strong cardiovascular heat strain. Exceedance durations across the 96-hour window were divided into four equal quartiles, mapped directly to alpha-channel color opacity.
This dual-layer mapping revealed striking spatial distributions: 90.77 percent of pixels in Cluster 0 fell into Class D, experiencing over 32 cumulative hours above the 40-degree threshold, confirming open paved intersections as severe, persistent hotspots. Conversely, directional Clusters 1 and 2 exhibited intermediate durations concentrated in Classes B and C, proving that while both experience comparable total heat durations, their temporal scheduling requires distinct mitigation timings. Cluster 3 functioned as a natural thermal buckler, with 88.64 percent of its area confined to lower exposure tiers. Operationally, the resulting map allows planners to interpret hue as the required intervention typology, such as high-canopy trees to block morning solar penetration versus reflective cool pavements to limit afternoon heat retention, while opacity dictates investment priority. The authors note that the framework’s boundaries currently reflect simplified ground assumptions approximating water bodies as asphalt and uncoupled soil hydrology, presenting future opportunities to integrate multi-physical models and automated generative design for climate adaptation.
Subject of Research: Unsupervised machine learning classification of urban thermal morphology and radiant temperature dynamics
Article Title: Scalable machine learning for urban thermal morphology classification: clustering high-resolution microclimate and dynamic mapping of radiant temperature
Article References: Baia, M., Balocco, C., & Bagnoli, F. (2026). Scalable machine learning for urban thermal morphology classification: clustering high-resolution microclimate and dynamic mapping of radiant temperature. Computational Urban Science, 6(1), Article 45. https://doi.org/10.1007/s43762-026-00278-1
Image Credits: AI Generated
DOI: 10.1007/s43762-026-00278-1
Keywords: urban microclimate, mean radiant temperature, machine learning, k-means clustering, urban heat islands, thermal comfort, climate resilience, spatial morphology, Scalable, machine, learning, urban
News Source: Teresa Odom. (November 6, 2026). Machine Learning Classifies Urban Heat Patterns Directly from Radiant Temperature Data. Scienmag.