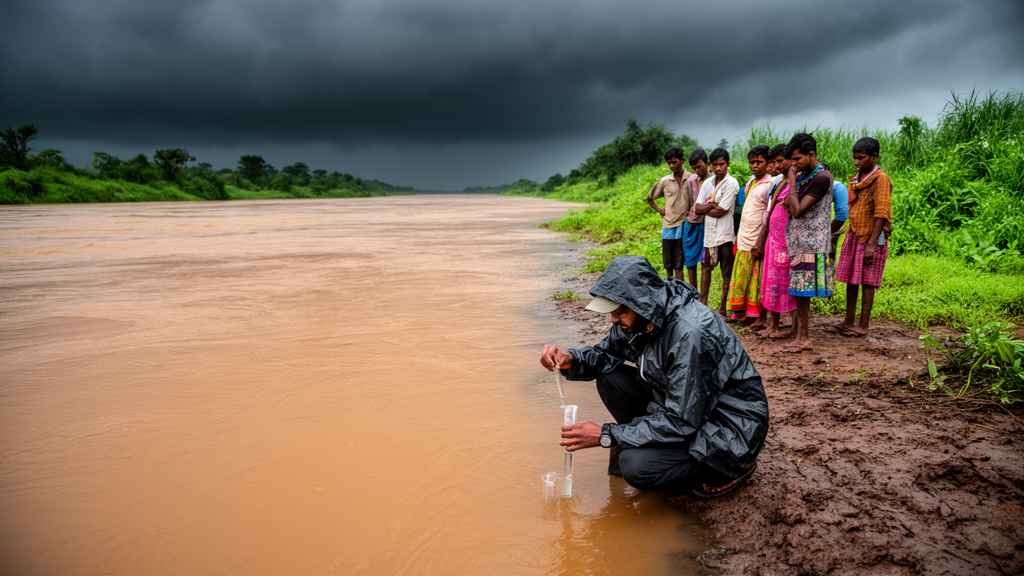
A twelve-year assessment of the Baitarani River in Odisha, India, has mapped how monsoon-season water quality varies along the river and pinpointed a handful of pollution hotspots, using a combination of water quality indices, multivariate statistics, multi-criteria decision-making tools and machine learning models. The study, published in Green Technology, Resilience, and Sustainability, analysed water samples from thirteen sampling stations collected between 2012 and 2024, drawing on data obtained from the State Pollution Control Board, Odisha. Sixteen physicochemical parameters were measured and compared against World Health Organization drinking water guidelines.
The most consistent finding concerned three basic indicators. Turbidity, electrical conductivity and total dissolved solids exceeded their acceptable limits under WHO guidelines throughout the entire sampling period. Turbidity ranged from 18.7 to 65.4 NTU, far above the 5 NTU permissible level, which the researchers attribute to the muddy monsoon runoff and sediments stirred from the riverbed. Total dissolved solids ranged from 98 to 218 milligrams per litre with an average of 156, and electrical conductivity ranged from 108 to 372 microsiemens per centimetre with a mean of 237.15, both above their respective WHO reference values. Other parameters, including pH, dissolved oxygen, calcium, magnesium, sodium, potassium, iron, chromium, chloride, sulphate and bicarbonate, remained within the WHO limits at the sampled sites.
Four different water quality indices produced broadly consistent but not identical verdicts on the river’s overall condition. The Weighted Arithmetic Water Quality Index, which ranged from 70 to 140, classified 69.23 percent of the samples as good and 30.77 percent as poor. Numerow’s Pollution Index, spanning 12.28 to 38.01, judged 92.31 percent of locations fit for drinking, while the Overall Index of Pollution rated 92.31 percent of sites as excellent and one site as slightly polluted, with computed values between 0.57 and 4.3. The Synthetic Pollution Index, ranging from 0.40 to 2.37, placed nine samples in the good category and four in the poor category. The researchers link the pollution at the affected locations to industrial production, agricultural practices and human activity.
One station stood out repeatedly. Site K-8, in the north-eastern part of the study area, recorded the highest values for biochemical oxygen demand, iron, chromium and several index scores, including the highest Numerow’s Pollution Index value of 38.01. The researchers attribute this to a combination of agricultural runoff, domestic drainage, solid waste disposal, direct release of untreated wastewater, industrial effluent and tidal influence. Spatial analysis using geographic information system interpolation identified the north and east of the basin as the most contaminated areas, worsened by uncontrolled discharge of contaminated water. Sites K-11, K-12 and K-13, located within a reservoir where slow water flow allows contaminants to accumulate, were also repeatedly flagged as degraded.
An entropy-weighted water quality index, which assigns objective weights to parameters based on statistical variability, ranged from 46.11 to 198 across the thirteen stations. Seven locations scored below 100, indicating excellent to good water, two sites were rated medium, and four sites in the north-eastern part of the study area emerged as unsafe for human consumption. Three multi-criteria decision-making methods were then applied to rank the sites: WASPAS scores ranged from 0.45 to 0.89, TOPSIS closeness coefficients from 0.17 to 0.78, and COCOSO scores from 1.38 to 3.13. Together these rankings identified K-8, K-11, K-12, K-13 and K-2 as the sites promoting unsuitability for drinking, with electrical conductivity, total dissolved solids and turbidity as the key indicators driving the results.
Two multivariate statistical techniques helped trace the likely origins of the contamination. Cluster analysis grouped the parameters and sampling sites into three clusters, pointing to irrigation systems, agricultural practices and water-rock interactions as the main pollution sources, with residential and agricultural activities highlighted as primary causes of river pollution. Discriminant analysis, run in a stepwise mode, extracted ten discriminating water quality indicators: pH, turbidity, electrical conductivity, dissolved oxygen, biochemical oxygen demand, sulphate, calcium, magnesium, sodium and potassium. The stepwise model achieved an assignment accuracy of 92.33 percent, while the standard mode using all fifteen parameters reached 100 percent.
Hydrogeochemical characterization added geological context. A Piper trilinear diagram delineated three water types, namely calcium-magnesium-chloride, calcium-chloride and calcium-bicarbonate facies, and a Gibbs plot placed more than 90 percent of the surface water samples within the rock dominance field, underscoring the importance of water-rock interactions and rock weathering. A mineral saturation index computed with the PHREEQC program showed 23.08 percent of locations under mineral dissolution, 46.15 percent in stable equilibrium and 30.77 percent at a precipitation interface. A sea water mixing index placed 61.54 percent of samples in a fresh water zone and 38.46 percent in a salt-water mixing category, with site K-8 severely contaminated by salt water intrusion.
For irrigation, the picture was more favourable on most measures. The sodium adsorption ratio, residual sodium carbonate, magnesium hazard, Kelley’s ratio and potential salinity all indicated that essentially all samples were suitable for irrigation, with values falling in their respective excellent or satisfactory classes. However, the permeability index, ranging from 3.81 to 6.30, placed all examined locations in Class III, the poor group, and the corrosivity ratio, spanning 0.5 to 1.31, marked one sample as unsuitable, with site K-8 reaching 1.31 and raising concerns about metal pipelines. An agriculture stability index ranging from 75 to 256, averaging 149.15, classified 38.46 percent of samples as poor and 7.69 percent as unsuitable for all crops, while more than 53 percent of water samples were deemed suitable for farming activities.
Machine learning models were trained to predict the entropy water quality index and several irrigation indices from the physicochemical data. The artificial neural network outperformed the gradient boosting regression model across the outputs. The best-performing configuration for the entropy index, ANN-2F, achieved a coefficient of determination of 0.97 with a root mean square error of 2.49 on the training set and 0.95 with a root mean square error of 2.175 on the validation set, with chloride and sodium identified as the two attributes most essential to the prediction. For the irrigation indices, neural network models reached coefficients of determination of 0.99 or higher, with bicarbonate, calcium, magnesium and sodium emerging as the main drivers of model performance.
The authors note several limitations. The analysis covers only the monsoon season, relies on data supplied by multiple departments and agencies, and does not include a thorough assessment of heavy metals such as lead and cadmium. They also caution that the reliability of these advanced techniques can be constrained by inconsistent data availability, regional variations in pollution sources and the lack of standardized methodologies, which may affect generalizability in resource-limited settings. As an observational monitoring study, the work identifies associations between land activities and water quality rather than proving causal effects, but the authors argue that the integrated framework could help Odisha’s authorities prioritize key locations for pollution management and water resource planning, particularly at the degraded north-eastern sites where strict control of turbidity, electrical conductivity and total dissolved solids is indicated.
Subject of Research: Monsoon-season surface water quality assessment of the Baitarani River in Odisha, India, using water quality indices, multivariate statistics and machine learning models
Article Title: Monsoonal impacts on water quality in the Baitarani River, Odisha: a comprehensive evaluation using water quality indices, multivariate statistics, and machine learning models for sustainable pollution control
Article References: Das, A. (2025). Monsoonal impacts on water quality in the Baitarani River, Odisha: a comprehensive evaluation using water quality indices, multivariate statistics, and machine learning models for sustainable pollution control. Green Technology, Resilience, and Sustainability, 5(1), Article 6. https://doi.org/10.1007/s44173-025-00024-6
Image Credits: AI Generated
DOI: 10.1007/s44173-025-00024-6
Keywords: Baitarani River, water quality index, Odisha, monsoon, machine learning, artificial neural network, turbidity, total dissolved solids, irrigation suitability, pollution hotspots, GIS, hydrogeochemistry
News Source: Blake Davidson. (October 30, 2026). Machine learning and water quality indices reveal monsoon pollution hotspots in Odisha’s Baitarani River. Scienmag.