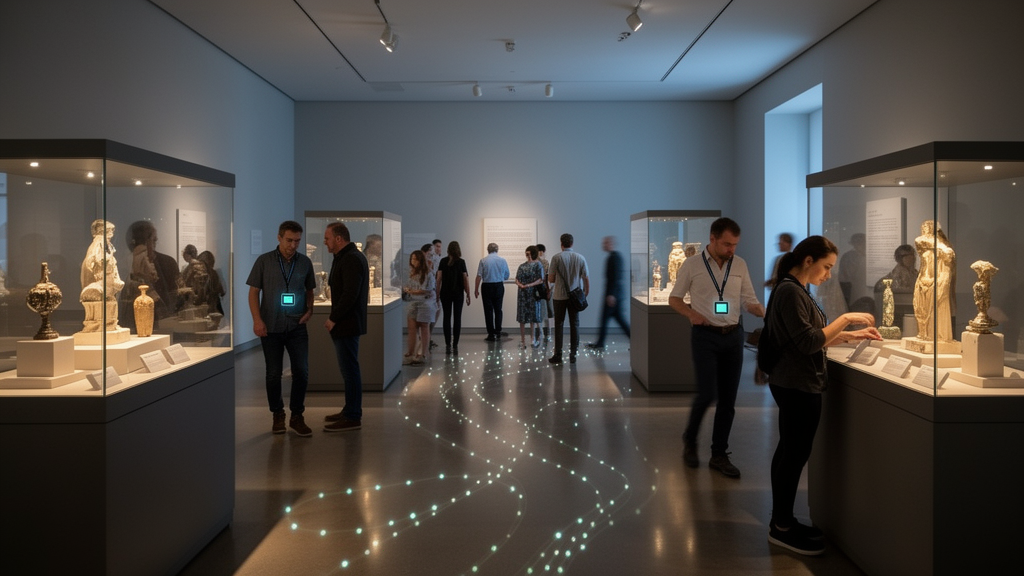
Researchers have turned an ultra-wideband (UWB) localization system loose inside a museum, tracking more than 1,500 visitors over three months and demonstrating, for the first time at this scale, how decimeter-level indoor positioning can transform mobility analytics. The study, published in Data Science and Engineering, deployed a permanent UWB infrastructure across a 40 by 15 square meter exhibition area on the second of the museum’s five floors, an area hosting 42 exhibits and explored by the vast majority of visitors. The result is one of the largest real-world UWB trajectory datasets for human mobility ever assembled, containing more than 11 million position records, which the team has now released publicly.
The technology at the heart of the work is fundamentally different from the wireless tools museums have used until now. UWB radios transmit pulses shorter than two nanoseconds, which allows devices to estimate the time of arrival of signals with extraordinary precision and to separate the true signal from multipath reflections. In the hardware used here, time resolution reaches 15 picoseconds, enabling distance estimates with decimeter-level accuracy. Previous work in the very same museum environment, with the same hardware and localization system, characterized positioning accuracy as a median error of 46 centimeters and a 75th percentile of 57 centimeters, with 96.2 percent of samples showing sub-meter error, despite non-line-of-sight conditions caused by cluttered surroundings and the human body itself attenuating the signal.
That precision matters because the alternatives fall short. Bluetooth Low Energy beacons, the technology of choice in prior museum studies at institutions including the Louvre in Paris, the Galleria Borghese in Rome, and the CoBrA museum in Amstelveen, derive distance from received signal strength, a measure sensitive to obstacles and multipath effects that yields errors of several meters. Even newer Bluetooth capabilities have limits: direction finding introduced in Bluetooth 5.1 achieves sub-meter accuracy only in controlled environments and can reach errors of several meters in cluttered real spaces, while the channel sounding feature of Bluetooth 6.0, despite a target accuracy of plus or minus 10 centimeters, has been shown to produce errors up to several meters depending on orientation, height, power level, and algorithm. In the studied museum area, the maximum distance between adjacent exhibits is only 47 centimeters, with a median of 8 centimeters, making such coarse technologies incapable of distinguishing one exhibit from another.
The campaign itself was deliberately unobtrusive. Each visitor entering the museum was offered the option of wearing a UWB tag, an MDEK1001 evaluation kit weighing just 41 grams, worn on the chest on a lanyard. Participation was entirely optional, informed consent procedures were followed, and no personal information was collected. Of 1,573 volunteers, 1,500 were correctly tracked after accounting for handling errors and battery malfunctions. Fourteen anchor nodes hidden in the ceiling, each connected to a Raspberry Pi and powered over existing Ethernet infrastructure, computed tag positions using time-difference-of-arrival techniques at a nominal rate of 12 Hz, with Kalman filtering to suppress outliers. After data cleaning separated individual visitors, distinct tours, and area transitions, the final dataset comprised 1,856 trajectories from 1,396 visitors containing over 9 million position units.
The researchers, Davide Vecchia, Fatima Hachem, Davide Molteni, Maria Luisa Damiani, and Gian Pietro Picco, first showed what raw trajectories alone can and cannot deliver. Basic analyses revealed that visitors arrive at the target area roughly an hour into their museum visit, at about 44 percent of their overall stay. The median stay in the target area was 8 minutes 8 seconds, with only 3.6 percent of visitors remaining under two minutes and about 19 percent staying longer than 15 minutes, up to a maximum of 48 minutes 30 seconds. Visitors spent markedly more time in the main sub-area, a median of 6 minutes 20 seconds, than in the sponsor area, where the median was 1 minute 46 seconds and about 15 percent of visitors never set foot at all.
Even the intended visitor route defied the curators’ design. The curators expected visitors arriving from the stairs to tour the western portion of the floor first, enter the main area from the south access, proceed through the sponsor area, and exit north. The data showed this path followed in only 49 percent of cases; 37 percent of visitors entered from the north and split evenly on their exit choice, while 14 percent entered and exited from the south. The authors suggest the north access sits to the right of the stairs, and people are naturally inclined to turn right at a fork, pointing to a need for more prominent signage.
But the core limitation of raw trajectories, and of the commercial heatmaps built from them, is that they cannot answer the question museum researchers have asked since Melton’s pioneering 1935 work and Serrell’s later studies: at what exhibits do visitors stop, and for how long? A heatmap showing high density near a table hosting three exhibits cannot distinguish visitors pausing to look from visitors simply walking past, nor say which exhibit held attention longer. The team therefore applied stop-move detection techniques, validated in earlier controlled and semi-controlled studies in the same environment, using the SeqScan algorithm with the configuration found optimal in prior work. Stops were defined as density-based clusters accounting for temporal duration, tolerating both localization noise and the small torso movements of a stationary visitor. Stops near an exhibit within one meter, after consultation with curators, were labeled peeks, and consecutive peeks at the same exhibit were aggregated into visits. A minimum presence of 10 seconds was set based on curatorial guidance.
The higher-level analysis produced 9,735 stops, of which 8,048, or 82.6 percent, occurred near exhibits, and 6,793 visits with a mean duration of 49.9 seconds. The refinement materially changed the picture of engagement. Raw trajectory data would have suggested 93 percent of tracked visitors engaged with at least one exhibit; the visit-based estimate was 10 percent lower, at 83 percent of the 1,500 tag-carrying visitors. Similarly, while trajectory data showed 85 percent of visitors spent time in the sponsor area, only 55 percent actually visited an exhibit there. On average, visitors engaged with exhibits for a total presence of 3 minutes 25 seconds, about 30 percent of their time in the target area, though with high variability. No visitor experienced the exhibition in full: visitors engaged with 11.2 percent of exhibits on average, with a maximum of 59.5 percent.
The exhibit-level findings held genuine surprises. The most attractive single point of interest, table T*1 in the sponsor area, drew 474 visitors, nearly one in three, while a small white tile labeled DS1 attracted only 32. Yet attractiveness and engagement diverged sharply. The exhibit BN2, hosting a touch-screen game for children, ranked only 17th in attractiveness but proved roughly six times more engaging than any other exhibit by mean presence per visitor, followed by FN3, which showcases a tray of soil with plants, an animal skeleton, and an interactive screen. Both appeared as high-density zones on the conventional heatmap, which was blind to these crucial differences. Grouping exhibits by table and zone showed main-east tables accruing more visitors than main-west, 1,055 versus 868, likely due to proximity to the entry accesses, and capturing 48 percent of total visitor presence.
The team also classified exhibits and visitors into archetypes using attractiveness and engagement quadrants, finding visitors significantly less passionate and curious on weekends yet more selective, though the authors caution the dataset contains only eight weekends. Mapping the order of visits revealed that 74 percent of visitors start at tables D, E, or F near the entrances, and movement among those tables is orderly while patterns in the western and sponsor zones are more chaotic. The authors emphasize that their contribution is not new algorithms but concrete, at-scale evidence of untapped potential: the leap from raw positions to semantic trajectories of visits is what truly unlocks UWB’s value. They note the approach extends naturally to retail and any domain where measuring presence near points of interest matters, and that the museum’s own curators, enticed by the results, already want a relocatable version of the system for temporary themed exhibitions.
Subject of Research: A UWB-based indoor mobility analytics study tracking museum visitors' stops and engagement with exhibits.
Article Title: Unleashing the Power of UWB for Indoor Mobility Analytics: A Museum Case Study
Article References: Vecchia, D., Hachem, F., Molteni, D., Damiani, M. L., & Picco, G. P. (2026). Unleashing the Power of UWB for Indoor Mobility Analytics: A Museum Case Study. Data Science and Engineering. https://doi.org/10.1007/s41019-026-00358-6
Image Credits: AI Generated
DOI: 10.1007/s41019-026-00358-6
Keywords: UWB, indoor positioning, museum analytics, mobility tracking, visitor behavior, stop detection, semantic trajectories, Bluetooth Low Energy, localization, data science, exhibit engagement, open dataset
News Source: Denise Maddox. (October 29, 2026). Ultra-Wideband Tracking Reveals How Museum Visitors Really Behave. Scienmag.