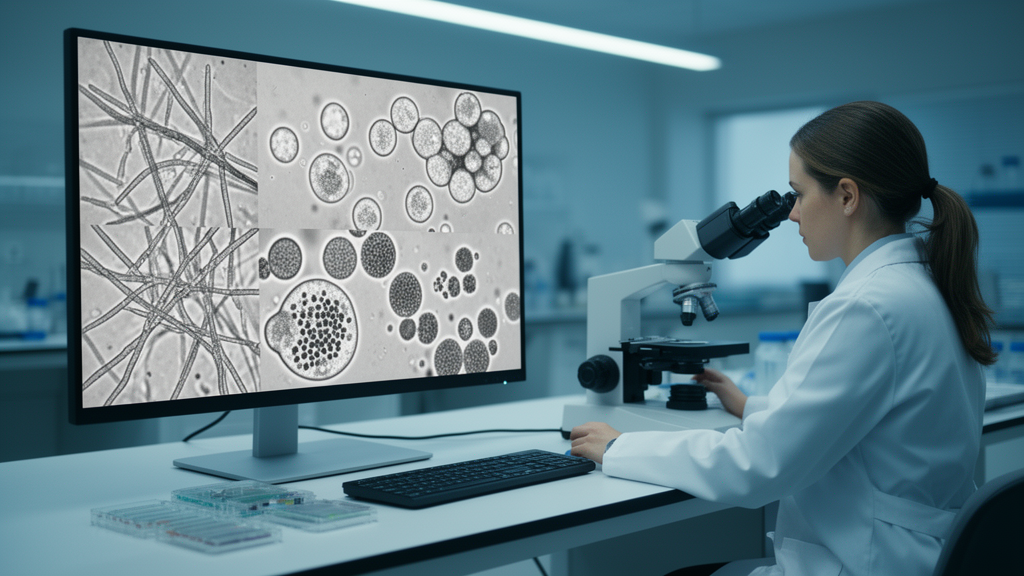
Fungi are shape-shifters. A single culture of the black yeast-like fungus Aureobasidium pullulans can contain smooth yeast cells, swollen cells, heavily vacuolated cells, budding pairs, clumps, septate filaments and more, and the balance between these forms shifts with pH, carbon source and osmotic stress. Tracking that balance by eye across hundreds of microscope images is slow, subjective and prone to disagreement between observers. A team at TU Wien now reports a tool designed to take over that job: TU_MyCo-Vision, an object detection system built on the Ultralytics YOLOv11m architecture that recognises 13 fungal morphotypes directly in standard brightfield microscopy images and hands the counts to an integrated analysis suite, all wrapped in a graphical interface that requires no programming skills.
The work, published in the journal Fungal Biology and Biotechnology, grew out of a practical bottleneck. Microscopy remains one of the most common ways to assess fungal phenotype, but sample preparation and operator skill vary, which limits how many samples can be processed and introduces bias. Existing automated tools tend to be narrow: some detect hyphae in clinical preparations, others classify a fixed set of Candida albicans shapes under differential interference contrast optics. Few offer morphotype-resolved detection under plain brightfield light, and fewer still connect detection to downstream statistics in a single, accessible package. The researchers wanted a system that could handle the polymorphic A. pullulans and, potentially, other taxa as well.
The technical core of the tool is a YOLOv11m detector trained on a custom dataset of 1,504 annotated images, most of them of A. pullulans, supplemented with Aureobasidium melanogenum and Trichoderma reesei to broaden morphological and taxonomic coverage. From full-size 1920 by 1080 pixel microscope frames, the team generated 15,437 cropped tiles of 640 by 640 pixels, which served as an image bank for annotation and dataset assembly. A trained annotator drew tight rectangular bounding boxes around cells in the LabelMe annotation tool, assigning each object to one of 13 morphological classes defined from microscopic observation: vacuolated single cells in several variants, cells with granular cytoplasm, general yeast-like cells, spheroidal cells, budding events, cell aggregates, irregular shapes, septate cells, and three filamentous classes covering septate hyphae or pseudohyphae, vacuolated hyphae and smooth non-septate hyphae.
Dataset construction was deliberately iterative. Three dataset versions, named X-ray, Yankee and Zulu, were built in succession, each split into five folds using stratified cross-validation based on object counts per class. The first X-ray dataset contained 1,028 manually annotated images with 8,575 annotated cells, but its class distribution was markedly uneven: yeast-like cells dominated, while heavily vacuolated cells and all filamentous classes were underrepresented, and septate and irregular cells were the rarest of all. The Yankee revision re-annotated vacuolated cells hidden inside clumps and removed ambiguous or poorly focused yeast-like instances. For the final Zulu dataset, the team used a trained model to auto-label previously unused images, then manually reviewed all 14,200 candidates and kept only 516 that met quality criteria, nearly doubling the representation of smooth filaments and substantially boosting heavily vacuolated and granular cytoplasm cells.
Performance improved with each cycle. Across the three model families, mean precision rose from 71.6 percent for X-ray to 74.6 percent for Zulu, mean average precision at the 50 percent intersection-over-union threshold climbed from 0.744 to 0.775, and the stricter mAP averaged over IoU thresholds from 50 to 95 percent rose from 0.536 to 0.573, while recall stayed stable between 71.8 and 73.0 percent. On an independent global test set of 166 images, the best Zulu model, Zulu_s3, achieved a mean precision of 73.4 percent, a recall of 66.5 percent, an mAP@50 of 73.5 percent and an mAP@50-95 of 54.5 percent across all 13 classes. The team selected Zulu_s3 as the representative model because precision matters particularly in morphotype quantification, where false-positive detections directly inflate counts in a culture.
Class-level results on the global test set reveal a biologically interpretable pattern of strengths and limits. Detection was strongest for morphotypes with clear, distinctive brightfield features: cells with granular cytoplasm reached an mAP@50 of 0.900 with a recall of 94.9 percent, dual-vacuole cells hit 0.912, heavily vacuolated cells 0.887, septate cells 0.897 with 90.0 percent precision, and single-vacuole cells 0.844. Yeast-like cells without distinctive features were detected adequately at 0.792. The persistent challenge lies in separating geometrically similar classes: 14 percent of single-vacuole cells were misclassified as yeast-like, 14 percent of heavily vacuolated cells as yeast-like, and 11 percent of spheroidal cells as either yeast-like or granular, reflecting subtle differences in intracellular content that brightfield optics resolve imperfectly, especially at lower magnifications or in dense fields.
Filamentous morphotypes remain the hardest problem. Vacuolated hyphae performed best among the filamentous classes with an mAP@50 of 0.712, while septate hyphae and pseudohyphae reached 0.577 and smooth non-septate hyphae 0.517, with classification accuracies of 57 and 58 percent respectively. The authors advise treating hyphal detections as presence-absence or semi-quantitative indicators rather than precise counts, because a single continuous hypha may be enclosed by multiple bounding boxes, which can overestimate filament abundance. Budding events were also difficult, with a recall of only 47.5 percent, and irregular cells remained the weakest class, since the category functions as a catch-all for cells that fit no other definition and therefore carries high internal variability.
To make the detector usable in practice, the researchers built a cross-platform graphical interface in PyQt5, packaged as single executables for Windows and macOS. The interface has three panels: a Detection panel for folder selection, class selection and parameter settings; an Analysis panel offering single-group and multi-group comparisons plus a class-exclusion module that can consolidate selected morphotypes, for example all three filamentous classes, into an Others category; and a Results Dashboard that displays original and annotated images side by side, an embedded CSV viewer and interactive plots. The analysis pipeline generates six quantitative summaries: absolute counts, relative abundance, mean relative abundance, normalised stacked bar plots, and hierarchical clustering heatmaps computed with Ward’s linkage on Euclidean distances. A preprocessing step excludes bounding boxes touching image edges to avoid counting partially visible cells, though this exclusion is deactivated for aggregates and filamentous classes.
Two validation exercises probe how far the system can be trusted. In the single-group workflow, applied to 90 images from the independent global test set, the pipeline processed every image and produced the full set of visualisations, with vacuolated single-cell classes and yeast-like cells dominating most fields as expected. In a comparison against manually curated ground-truth annotations on the same 90 images, the overall compositional structure was well preserved, and yeast-like cells and granular cytoplasm cells were recovered with high fidelity, at 24.7 versus 25.5 percent and 6.4 versus 6.6 percent relative abundance respectively. The largest deviations appeared for budding events, underestimated at 11.6 versus 14.9 percent, vacuolated single cells, and smooth filaments, overestimated at 14.5 versus 7.8 percent. Mean relative abundance narrowed some gaps but did not fully compensate for systematic recall deficiencies.
The most exploratory result is a multi-group test on genera the model never saw during training: Candida albicans, Komagataella phaffii and Aspergillus niger. A. niger conidia were assigned almost exclusively to the spheroidal class, consistent with their near-spherical geometry, and both K. phaffii groups were similarly enriched for spheroidal cells, with septate filaments detected in the GS115 group in line with that strain’s known pseudohyphal growth. The C. albicans group showed a markedly more heterogeneous profile, contributing budding and hyphal classes in addition to yeast forms, consistent with its well-documented polymorphism. The authors are careful to frame these cross-species profiles as exploratory rather than exact quantitative assessments or taxonomically diagnostic readouts, noting that the patterns have not been systematically validated against existing image analysis tools or reference modalities. All code, standalone executables, model weights and datasets are available on GitHub and Zenodo, positioning TU_MyCo-Vision as a practical starting point for automated morphotype profiling that lowers the barrier to quantitative microscopy for researchers without image analysis expertise.
Subject of Research: A deep learning object detection tool for identifying and quantifying fungal morphotypes in brightfield microscopic images
Article Title: Fungal morphotype detection and quantification in microscopic images with TU_MyCo-vision: a user-friendly deep learning object detection tool
Article References: Deopujari, K. J., Schmal, M., Danner, C., Qayyum, Z. A., Zwerus, J. T., Kopp, J., Besleaga, M., Shirvani, R., Mach-Aigner, A. R., Mach, R. L., & Zimmermann, C. (2026). Fungal morphotype detection and quantification in microscopic images with TU_MyCo-vision: a user-friendly deep learning object detection tool. Fungal Biology and Biotechnology, 13(1), Article 14. https://doi.org/10.1186/s40694-026-00215-1
Image Credits: AI Generated
DOI: 10.1186/s40694-026-00215-1
Keywords: TU_MyCo-Vision, YOLOv11m, object detection, fungal morphotypes, brightfield microscopy, Aureobasidium pullulans, deep learning, morphotype quantification, graphical user interface, Candida albicans, Komagataella phaffii, Aspergillus niger
News Source: Blake Davidson. (October 28, 2026). Deep learning tool reads 13 fungal morphotypes from plain microscope images. Scienmag.