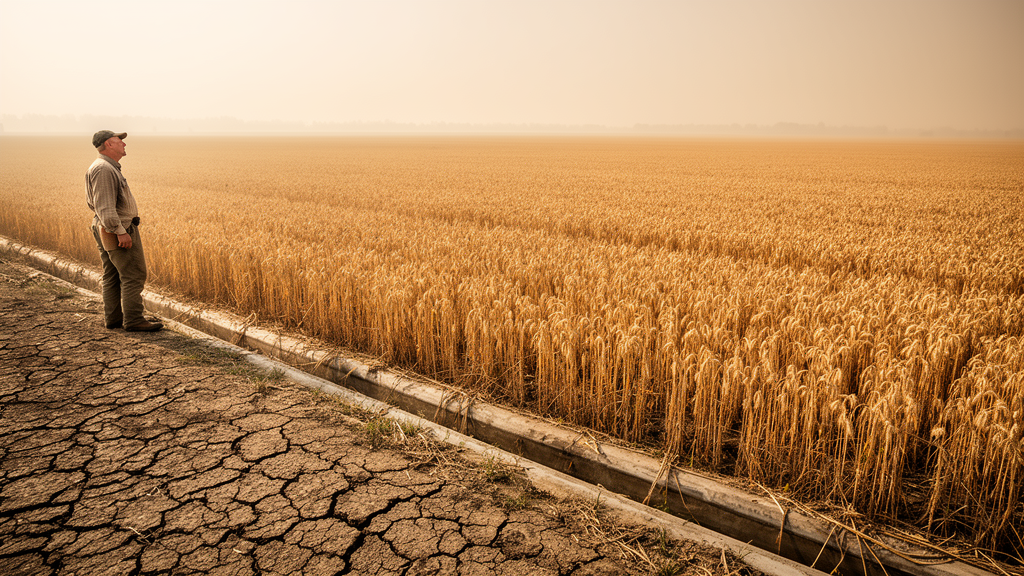
As the atmosphere grows drier, the way croplands trade water for carbon does not change smoothly. Instead, it appears to pass through a threshold. A new study of the Songhua River Basin in northeastern China, published in Ecological Processes, reports that agroecosystem water use efficiency—the amount of carbon a landscape gains for each unit of water it loses—responds nonlinearly to rising vapor pressure deficit, the gap between how much moisture the air can hold and how much it actually contains. Above a basin-scale breakpoint of approximately 0.41 kilopascals, the sensitivity of gross primary productivity to vapor pressure deficit increased significantly, while the sensitivity of evapotranspiration showed no significant change, an asymmetric carbon–water response that pushed water use efficiency steadily downward.
The research team, led by Youli Ma and Fengyan Wang with colleagues including Mingchang Wang, Xunhua Zheng, and Hongchao Fan, assembled a multisource dataset spanning 111 sub-basins of the Songhua River Basin from 2002 to 2024. The basin covers roughly 5.56 × 10⁵ square kilometers, receives 400 to 800 millimeters of annual precipitation with more than 70 percent falling between June and September, and devotes about 40 percent of its area to cropland dominated by maize, soybean, and rice. By harmonizing MODIS-derived gross primary productivity and evapotranspiration products on a common 8-day framework and averaging valid growing-season values, the researchers generated 2,553 sub-basin-year observations of water use efficiency, defined throughout as gross primary productivity divided by evapotranspiration.
Before probing the threshold, the team established which factors best explain regional variation in water use efficiency. An XGBoost model, tuned through Bayesian optimization and trained on 80 percent of the chronologically ordered observations, explained a substantial share of the variation in the held-out test data, achieving a coefficient of determination of 0.869. Shapley Additive exPlanations analysis ranked leaf area index and vapor pressure deficit as the most influential predictors, followed by soil bulk density, precipitation, soil clay content, and elevation. Higher leaf area index generally contributed positively to predicted water use efficiency, whereas higher vapor pressure deficit predominantly contributed negatively. Agricultural variables, including phosphorus fertilizer application and the planted areas of rice and soybean, contributed less than the leading vegetation, climatic, and soil variables.
The nonlinear signal emerged clearly in two complementary analyses. Shapley values for vapor pressure deficit shifted from positive to negative as the deficit increased, marking a transition in the model’s baseline prediction. A generalized additive model fitted to the data showed a nonlinear decline in water use efficiency with rising deficit, and the first derivative of that fitted curve reached its minimum at approximately 0.27 kilopascals—the VPD level at which water use efficiency declined most rapidly. The authors are careful to distinguish this point of maximum sensitivity from the primary breakpoint itself, which a two-segment piecewise linear fit placed at approximately 0.41 kilopascals, where the slope of the relationship changes. Neither value, they stress, should be read as a fixed physiological limit.
How robust is that 0.41-kilopascal figure? The researchers tested it by repeatedly subsampling 70 percent of the observations without replacement and refitting the two-segment model, 500 times in all. The resulting breakpoint estimates had a mean of 0.412 kilopascals and a 95 percent empirical uncertainty interval of 0.405 to 0.420 kilopascals—a narrow band indicating limited variation in the regional estimate under the subsampling procedure. Stability at the basin scale, however, turned out to mask considerable heterogeneity beneath it.
When the same piecewise fitting was applied separately to each of the 111 sub-basins using annual growing-season values, statistically supported breakpoints—cases where the two-segment model significantly outperformed a single linear fit at p < 0.05—appeared in 59 sub-basins, or 53.2 percent. In the remaining 52, the segmented model offered no significant improvement, which the authors note indicates insufficient statistical support for a local breakpoint under their framework rather than an absence of water use efficiency responses to vapor pressure deficit. Among the 59 supported sub-basins, breakpoint estimates ranged from 0.273 to 0.634 kilopascals, with a mean of 0.443 kilopascals and a standard deviation of 0.084 kilopascals. Higher estimates clustered in the central and southern agricultural areas and the southwestern basin; lower ones predominated in the north and east.
What explains that spatial spread? Across the supported sub-basins, breakpoint magnitude was negatively associated with mean growing-season precipitation total (Spearman ρ = −0.49, p < 0.001), leaf area index (ρ = −0.72, p < 0.001), and soil bulk density (ρ = −0.79, p < 0.001), and positively associated with the proportion of C4 crops, calculated as maize planted area divided by the combined maize, rice, and soybean area (ρ = 0.63, p < 0.001). Breakpoint magnitude was also negatively associated with interannual water use efficiency variability (ρ = −0.36, p = 0.006), a covariation the authors explicitly decline to interpret as evidence of ecosystem resilience. Because precipitation covaries with vegetation, soil properties, and other climatic factors, and because crop distributions follow climatic and management gradients, the study frames all of these as associations rather than demonstrated causal effects of individual factors.
To test whether the pattern extended beyond one basin, the team turned to independent eddy covariance observations. From an initial pool of 63 candidate cropland sites worldwide, data completeness screening retained 28 sites spanning Asia, Europe, North America, and Africa, growing maize, soybean, wheat, and rice. Site-level analysis retained statistically supported breakpoint estimates for 20 of those 28 sites—12 of 15 in Europe, 4 of 8 in Asia, all 3 in North America, and 1 of 2 in Africa. The retained estimates ranged from approximately 0.23 to 0.65 kilopascals, with a mean of 0.43 kilopascals and a median of 0.46 kilopascals, closely matching the basin-scale figure despite substantial scatter among individual sites.
The flux-tower data also revealed what happens to surface energy partitioning when the threshold is crossed. After centering vapor pressure deficit on each site’s own breakpoint, both latent heat flux and sensible heat flux increased above the transition. Paired comparisons across the 20 sites showed higher standardized Bowen ratios—the ratio of sensible to latent heat—and lower evaporative fractions above the breakpoints, indicating a relative shift in energy partitioning toward sensible heat rather than an absolute decline in latent heat flux. Records with very low fluxes were excluded to keep the ratio-based metrics stable, and differences were assessed with paired, two-sided Wilcoxon signed-rank tests.
The authors are candid about the limits of their design. Water use efficiency was estimated from MODIS-derived products whose values may depend on the same climatic forcing that drives vapor pressure deficit, and because the deficit covaries with temperature, precipitation, radiation, and vegetation conditions, the observed relationship cannot be read as the isolated causal effect of atmospheric dryness. Management-related associations relied on county-level statistics aggregated to sub-basins, which may miss field-level variation. Still, the convergence between the satellite-based basin estimate and the tower-based site mean, and the consistent asymmetric response of carbon uptake versus evapotranspiration above the threshold, give the finding weight. The practical upshot is sobering: as sustained warming and atmospheric drying continue in this and similar agricultural regions, the roughly 0.41-kilopascal breakpoint offers a regional reference point for anticipating when cropland carbon–water trade-offs sharpen—but the study’s own spatial analysis shows there is no single universal threshold, and local environmental and agricultural context remains essential for interpreting how any given landscape will respond.
Subject of Research: Nonlinear thresholds in agroecosystem water use efficiency responses to rising vapor pressure deficit
Article Title: Nonlinear threshold responses of agroecosystem water use efficiency to increasing vapor pressure deficit
Article References: Ma, Y., Wang, M., Zheng, X., Fan, H., & Wang, F. (2026). Nonlinear threshold responses of agroecosystem water use efficiency to increasing vapor pressure deficit. Ecological Processes, 15(1), Article 100. https://doi.org/10.1186/s13717-026-00757-7
Image Credits: AI Generated
DOI: 10.1186/s13717-026-00757-7
Keywords: water use efficiency, vapor pressure deficit, agroecosystems, Songhua River Basin, eddy covariance, breakpoints, carbon-water coupling, remote sensing, evapotranspiration, gross primary productivity, energy partitioning, climate change
News Source: Alan Morgan. (October 28, 2026). Cropland water use efficiency hits a tipping point as air dries. Scienmag.