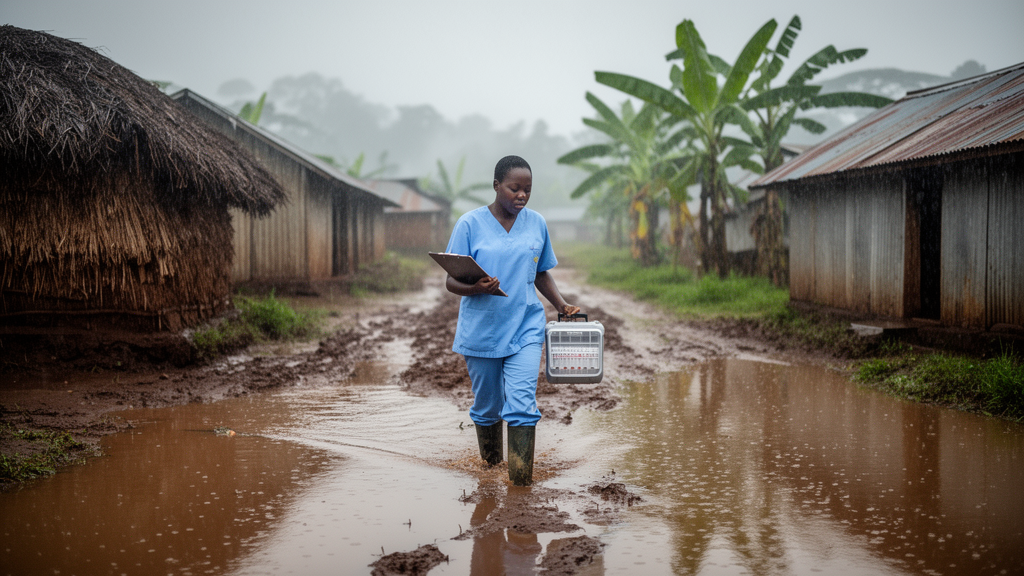
Years of heavier rainfall are associated with more cholera cases in the districts of Uganda where outbreaks cluster most often, according to a new retrospective ecological study published in BMC Infectious Diseases.
Cholera remains a global public health concern, particularly in low- and middle-income countries where inadequate water, sanitation, and hygiene persist. Transmission can be influenced by environmental factors such as rainfall, water availability, sanitation conditions, and contamination sources. Earlier work by the research team had used spatial cluster analysis to identify Ugandan hotspot districts with a high occurrence of cholera clustering; the new study built on that foundation by asking whether rainfall totals within those districts tracked the annual number of cases recorded there.
The study used a retrospective ecological design with district-level data from 2012 to 2022. Cholera surveillance data came from Uganda’s Ministry of Health, while rainfall estimates were drawn from the Climate Hazards Group InfraRed Precipitation with Stations (CHIRPS) dataset. Daily rainfall estimates were processed in Google Earth Engine and aggregated to district-level annual totals. Exploratory analyses included descriptive statistics, scatterplots, and checks for overdispersion and zero inflation in the count data.
For the primary analysis, the researchers used generalized estimating equation (GEE) negative binomial regression, fitted in Stata version 18. In addition, the team conducted district-level analyses as exploratory assessments to examine how the rainfall–cholera relationship might differ from one hotspot district to another.
The data revealed considerable spatial and temporal variation in annual rainfall across the hotspot districts. Cholera case counts ranged from zero to 577 cases per district-year, and 46 of the 154 district-year observations — 29.9 percent — recorded no cases at all, a pattern that shaped the choice of count models able to handle zeros and overdispersion.
In the primary GEE model, annual rainfall showed a positive association with annual cholera case counts. A 100 mm increase in annual rainfall corresponded to an estimated 13.2 percent increase in annual cholera case counts, with a count ratio of 1.132 and a 95 percent confidence interval of 1.024 to 1.251. Because the confidence interval excludes one, the primary estimate reached conventional statistical significance.
However, the authors urge caution. Sensitivity analyses yielded estimates that were directionally similar but less precise, and these did not consistently demonstrate statistical significance. The study team states explicitly that this finding should be interpreted with appropriate caution, and the sensitivity results suggest the size of the rainfall effect is uncertain.
The exploratory district-level analyses added a further layer of nuance: they suggested substantial heterogeneity in the rainfall–cholera relationship across hotspot districts, meaning the association observed in the pooled model does not necessarily apply uniformly to every district.
The authors frame the study as an assessment of the association between annual district-level rainfall totals and annual cholera case counts within previously identified hotspot districts, not as a demonstration of causation. As an ecological design using district-level aggregates, the analysis cannot attribute risk to individuals, and the case counts were not adjusted for population size. The authors note that future studies should incorporate population-adjusted incidence measures, seasonal rainfall indicators, and additional environmental, WASH, demographic, and health-system variables to clarify how rainfall relates to cholera transmission in these settings.
Subject of Research: The relationship between annual rainfall and annual cholera case counts in Uganda's cholera hotspot districts
Article Title: From spatial clusters to annual rainfall: assessing the relationship between rainfall and annual cholera case counts in Uganda
Article References: Tumuhamye, N., Kasasa, S., Atuyambe, L. M., Owundo, S., Ssengooba, F., & Mayega, R. W. (2026). From spatial clusters to annual rainfall: assessing the relationship between rainfall and annual cholera case counts in Uganda. BMC Infectious Diseases. https://doi.org/10.1186/s12879-026-14729-x
Image Credits: AI Generated
DOI: 10.1186/s12879-026-14729-x
Keywords: cholera, Uganda, rainfall, hotspot districts, ecological study, negative binomial regression, CHIRPS, surveillance data, water and sanitation, public health, spatial, clusters
News Source: Ophelia Keating. (October 27, 2026). Rainfall linked to higher cholera case counts in Uganda’s hotspot districts. Scienmag.