A behavior-driven redesign of smart home interfaces cut task completion times by 30.8% to 49.8% and error rates by 56.6% to 64.8% in a controlled experiment with 40 regular smart home app users. The study tested a framework called MAOV—Monitor, Analyze, Optimize, Validate—which combined five behavioral data streams with node-level diagnosis, machine-learning-assisted user segmentation and human-led interface changes. Participants completed seven realistic tasks using baseline and optimized laboratory prototypes in a within-subjects design. The optimized flows also raised mean System Usability Scale scores from 61.45 to 78.10, lowered perceived workload by 40.6% and met the framework’s predefined validation criteria in its first cycle. These findings apply to scripted prototypes, however, and do not yet establish that the approach will work on live commercial platforms or in occupied homes.
The work addresses a persistent problem in smart home design: as ecosystems add more connected devices, their interfaces accumulate pairing procedures, nested automation menus, scattered status displays and voice controls that can fail without a clear explanation. Conventional usability studies often depend on expert assessments, interviews, questionnaires or summary-level task observations. Such methods can identify broad dissatisfaction, but they may not reveal which individual interaction step is responsible for extra time, repeated errors or backtracking. The researchers positioned MAOV as a human–computer interaction and usability-engineering framework that turns detailed behavioral evidence into specific design hypotheses while keeping final redesign decisions with people. Its laboratory abstraction drew common interaction patterns from Xiaomi Mijia, Huawei Smart Life, Alibaba Smart Living and Tmall Genie rather than testing one proprietary ecosystem.
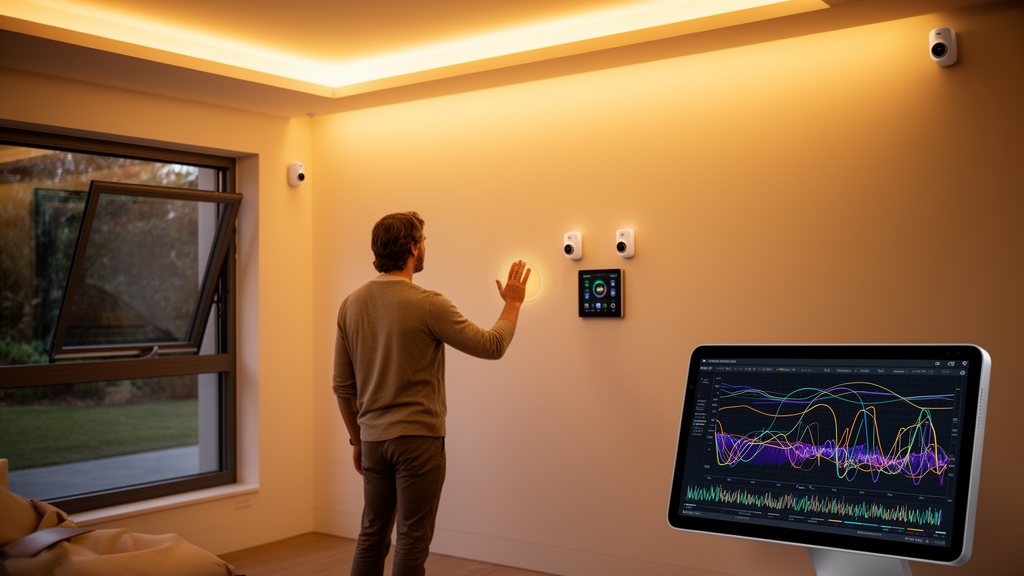
Five synchronized data streams were recorded throughout each task. The first was a timestamped application event log containing taps, page transitions, back actions, failed attempts and error clicks. The second combined click heatmaps with eye-tracking fixation data, including fixation duration, time to first fixation and scanpath sequence. Voice logs captured recognized commands, confidence scores and whether a user completed a task or fell back to touch input. Interface telemetry recorded response delays, connection success, failures and cross-device coordination delays. The fifth stream consisted of post-task System Usability Scale, NASA-TLX workload assessments and a single satisfaction rating. A shared millisecond timestamp server and page-transition markers aligned the streams into node-level intervals, allowing researchers to represent each interaction as a User–Task–Node record containing dwell time, errors, back actions, completion, visual attention, voice success and response delay.
At the heart of the diagnostic system was the Interaction Bottleneck Index, or IBI, a weighted combination of normalized dwell time, error rate, back-action rate and task success. Dwell time and errors each carried a weight of 0.30, back actions 0.25 and success a negative weight of 0.15. The coefficients were set before outcome analysis. A sensitivity analysis using equal, time-heavy, error-heavy and back-action-heavy alternatives produced Jaccard similarities of 0.882 to 1.000 with the original top-third set of baseline nodes, suggesting that the selected bottlenecks were not an artifact of one particular weighting. Local IBI values were used to locate friction within a task, while a globally normalized version prioritized nodes across the full baseline set. The upper-third rule was explicitly a distribution-relative screening device rather than a transferable severity threshold, and all normalization bounds were retained between conditions for comparison.
To turn the five streams into representations that could support user grouping, the team developed the Adaptive Multi-modal Behavioral Fusion Network, or AMBF-Net. Separate multilayer perceptrons encoded each modality, while a Bottleneck-Modulated Cross-Modal Excitation module adjusted their relative influence according to the IBI score. A learnable coupling matrix added a small number of parameters representing expected relationships among data types, and attention mechanisms modeled interactions among available modalities. Masking ensured that a structurally absent voice stream was not treated as a failed voice interaction. The model was trained with reconstruction, IBI-regression and bottleneck-classification objectives, using participant-level train, validation and test splits to prevent records from the same person entering multiple partitions. Its learned embeddings were then used for K-means++ clustering, with the number of clusters selected from values between two and 12.
Clustering produced three behavioral archetypes. Fourteen participants, or 35%, were classified as Efficient, with comparatively short task times and low error rates. Sixteen participants, or 40%, were categorized as Hesitant; this group had the longest task durations, including an average of 168.7 seconds for automation scene creation, alongside moderate errors. Ten participants, or 25%, formed the Error-Prone group, which recorded the highest error rates, including 0.470 on the scene-creation task, despite completing tasks faster than the Hesitant group. AMBF-Net embeddings produced a Silhouette score of 0.387 and a mean Bootstrap Adjusted Rand Index of 0.984 across 200 resamples. By comparison, raw features yielded a Silhouette score of 0.315 and a Bootstrap ARI of 0.970. These values indicate clearer separation and greater stability for the learned representations in this sample, although the authors cautioned that a larger and more diverse population would be needed to strengthen external validity.
The component profiles behind each high-IBI node guided different interventions rather than a blanket reduction in menu depth. Device pairing was compressed from seven nodes to four using QR-code or automatic detection, Wi-Fi auto-fill and fewer confirmation steps. Automation scene creation fell from eight nodes to five through templates, visual rule editing and merged trigger configuration. Status monitoring shrank from four nodes to two when live state was displayed directly on the device screen, eliminating a secondary tab. Feature discovery fell from six nodes to three, cross-device control from nine to five, device group setup from seven to four and voice-app interaction from five to three. This distinction mattered. The pairing bottleneck and status-monitoring bottleneck had similarly high IBI values, but the former was driven mainly by data-entry demands while the latter reflected inaccessible information and prolonged searching. A ranking based only on errors would have overlooked the status problem, which yielded the largest time reduction once the redesign surfaced information directly.
Across all seven tasks, completion times fell significantly, with the largest improvement in status monitoring, where mean time decreased from 42.7 to 21.4 seconds, a 49.8% reduction. The smallest reduction was 30.8% in the voice-app hybrid task, where the speech-recognition engine was unchanged and the gain came chiefly from better fallback routing. Error rates declined by 56.6% to 64.8% across the task battery, and all task-time and error-rate comparisons remained significant after Bonferroni correction. Effect sizes were large, ranging from 1.317 to 2.090 for completion time and from 1.636 to 2.142 for errors. Auxiliary measures pointed in the same direction: fixation efficiency improved by 38.4% to 49.1%, voice interaction gains were concentrated in tasks with redesigned fallback behavior, and interface response delays fell following preloading and clearer progress feedback.
Participants also reported markedly better experiences with the optimized interfaces. Mean SUS scores increased from 61.45 with a standard deviation of 12.86 to 78.10 with a standard deviation of 7.94, moving the prototype from the “marginal” range to a “good” classification under the study’s 68-point benchmark. Mean NASA-TLX workload scores declined from 60.68 to 36.05, a 40.6% reduction, while average satisfaction rose from 3.40 to 4.23 on the five-point scale. The archetype analysis suggested that different interventions may have benefited different groups: hesitant users gained most in absolute completion time from template-based configuration, whereas error-prone users showed their largest error and proportional time reductions. The researchers described this pattern as suggestive rather than conclusive because a formal interaction test between cluster membership and condition was not conducted.
The result is promising but tightly bounded by the experimental design. Forty participants were recruited from campus and online announcements; all reported at least three months of regular smart home app use. The prototypes reproduced selected interface hierarchies, labels, transitions and task paths, but commercial APIs and physical-device actions were represented by scripted states. Fixed task order preserved dependencies such as pairing before monitoring, and a 15-minute break separated baseline and optimized sessions, while Latin-square assignment balanced which prototype came first. Only one complete MAOV cycle was evaluated, so the framework’s feedback loop, stopping rule and performance across repeated cycles remain conceptual. Formal comparison with expert-only triage or single-metric diagnosis is also absent. Before deployment, the method will need longitudinal testing on live platforms and in occupied homes, where network failures, asynchronous device states, household routines, privacy constraints, concept drift and repeated use could change both the measurements and the benefits of redesign.
Subject of Research: Controlled evaluation of multimodal behavioral analysis for smart home interface optimization
Article Title: Multimodal user behavior analysis supports closed loop optimization of smart home interaction flows
Article References: Wei, X., & Hao, P. (2026). Multimodal user behavior analysis supports closed loop optimization of smart home interaction flows. Discover Artificial Intelligence, 6(1), Article 1154. https://doi.org/10.1007/s44163-026-02205-z
Image Credits: AI Generated
DOI: 10.1007/s44163-026-02205-z
Keywords: smart home usability, multimodal data, interaction design, eye tracking, behavioral clustering, user experience, deep learning, human-computer interaction, Multimodal, user, behavior, analysis
News Source: Blake Davidson. (October 26, 2026). Multimodal user behavior analysis supports closed loop optimization of smart home interaction flows. Scienmag.