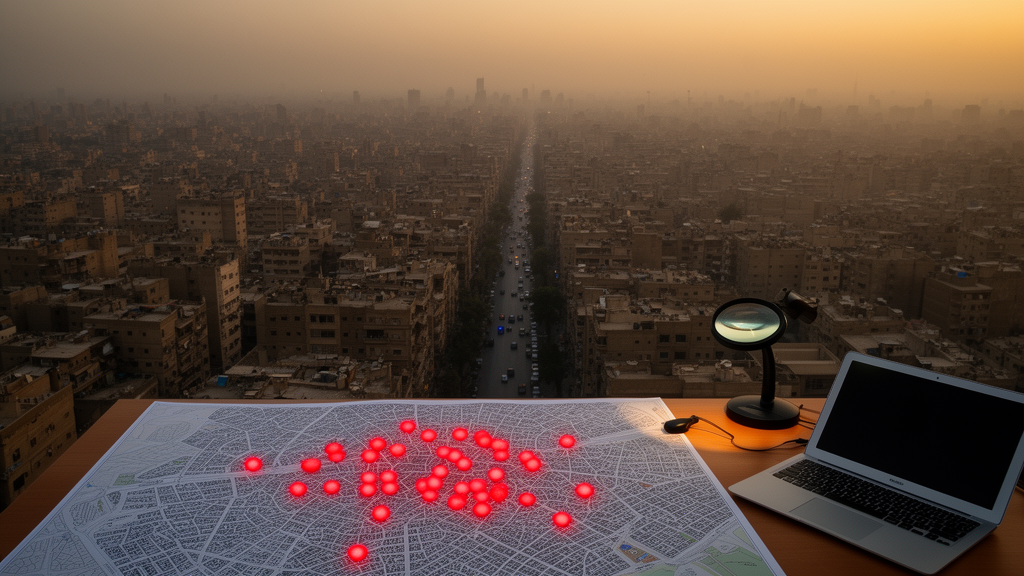
In one of the most ambitious attempts yet to link urban environment and cancer risk in the Middle East, researchers have built a detailed geographic vulnerability map of Greater Cairo, revealing that parts of the megacity’s western, northwestern, and southern districts carry a substantially higher relative burden of environmental and socioeconomic conditions associated with lung cancer. The study, published in BMC Public Health, combines satellite-derived pollution data, census indicators, and hospital records into a single analytical framework that its authors say could reshape how cities across the developing world plan for environmental health.
The research team, led by Rasha H. Ramadan of Egypt’s National Authority for Remote Sensing and Space Sciences and Mona S. Ramadan of United Arab Emirates University, set out to answer a deceptively simple question: which neighborhoods of Greater Cairo are most vulnerable, in a relative sense, to the constellation of urban conditions that make lung cancer more likely? To do so, they assembled twenty-nine spatial criteria organized into four domains: socioeconomic, residential, environmental, and physical. Each criterion layer was oriented so that larger standardized values represented greater relative vulnerability, reclassified onto an ordinal 1-to-8 scale, and then weighted using the Analytic Hierarchy Process, a structured mathematical technique for converting expert judgment into consistent numerical weights.
Technically, the framework relies on weighted linear combination, a cornerstone of multi-criteria decision analysis. Under this approach, every pixel of the city receives a vulnerability score computed as the sum of its reclassified criterion values multiplied by their assigned weights. The researchers ran the combination under four domain-priority scenarios, in which one domain at a time received the largest weight, and one equal-weight scenario in which all domains contributed equally. Every Analytic Hierarchy Process matrix met the prespecified consistency ratio threshold of less than 0.10, with a maximum observed value of 0.0216, indicating that the expert judgments encoded in the weights were internally coherent rather than arbitrary.
Because the weights themselves are analyst-defined assumptions, the team stress-tested them with 1,000 Monte Carlo perturbations, randomly shifting criterion weights by up to 15 percent and recomputing the maps. The result was striking stability: under equal-domain weighting, the rank order of criterion weights held with a mean Spearman correlation of 0.9912. In plain terms, the relative importance the framework assigns to each indicator barely budged even when the numbers were shaken. The authors are careful to note that this quantifies weight-rank stability, not spatial or outcome validation, a distinction that matters for how the maps should be read.
The resulting vulnerability surfaces show higher relative vulnerability concentrated in parts of western, northwestern, and southern Greater Cairo, with the exact pattern shifting depending on which domain was prioritized. The environmental domain alone classified 118.087 square kilometers of the city as low vulnerability, 626.825 square kilometers as medium, and 660.491 square kilometers as high. The physical domain, which includes terrain and built-form indicators derived from digital elevation models and satellite missions such as SRTM, produced 140.073, 635.396, and 629.935 square kilometers across the same three classes. These are not small margins; they cover hundreds of square kilometers of one of Africa’s largest urban agglomerations.
But the researchers did not stop at mapping. In a complementary hospital-based case-control analysis, they recruited 511 lung-cancer cases and 256 controls between 2022 and 2024 at the National Cancer Institute of Cairo University, a national oncology referral center drawing patients from governorates across Egypt and from diverse socioeconomic backgrounds. Controls consisted of patients with malignancies other than lung cancer, as well as visitors or accompanying persons with no known lung-cancer diagnosis. Residence codes were used strictly as nominal keys for an exact district-score lookup, ensuring that the geographic index could be joined to individual records without treating the GIS output as a causal estimate.
The individual-level findings are compelling. In a complete ten-predictor logistic model, smoking, proximity to pollution sources, and the residential-area vulnerability score carried the largest positive coefficients, meaning that these three factors were most strongly associated with lung-cancer case status in the sample. The logistic model achieved an area under the receiver-operating-characteristic curve of 0.82, with a 95 percent confidence interval of 0.78 to 0.86, indicating good discriminative ability. A machine-learning counterpart, an internally cross-validated radial-basis-function support vector machine, reached 79 percent accuracy, 81 percent sensitivity, and 76 percent specificity. Neither model, the authors emphasize, constitutes external validation of the GIS index; they provide complementary associations within a referral-hospital sample.
What makes the study unusual, and likely to spark debate, is its methodological candor. Composite GIS maps of disease vulnerability are often interpreted more strongly than their data support, and the authors explicitly warn against this. The GIS outputs, they write, identify relative vulnerability under explicit weighting assumptions; they do not estimate lung-cancer incidence or individual probability. The framework is most appropriately used for environmental surveillance, hypothesis generation, and prioritization of future population-based validation, not for clinical prediction or policy mandates based on a single map layer.
Still, the implications for sustainable health planning are considerable. Greater Cairo, home to more than twenty million people, faces chronic air-quality challenges, rapid informal urban growth, and stark socioeconomic gradients. By making the weighting assumptions transparent, testing them with Monte Carlo perturbation, and pairing the spatial index with individual-level correlates, the researchers have produced a template that other rapidly urbanizing regions could adapt. The study received no external funding and was approved by the Ethics Committee of the National Cancer Institute, Cairo University, with written informed consent obtained from all participants in accordance with the Declaration of Helsinki.
For now, the maps of Greater Cairo stand as a carefully hedged but powerful piece of evidence: a relative vulnerability atlas built from twenty-nine indicators, four domains, and thousands of perturbed weight combinations, pointing planners toward the neighborhoods where environmental and social conditions converge most sharply. Whether those neighborhoods see targeted interventions, from air-quality monitoring to screening outreach, will depend on the population-based validation studies the authors say must come next. But the framework itself, open access and fully documented, offers cities from Lagos to Jakarta a rigorous starting point for asking where vulnerability lives, and what to do about it.
Subject of Research: Environmental health and spatial epidemiology of lung cancer in Greater Cairo
Article Title: Urban environmental vulnerability to lung cancer in greater Cairo: a GIS-based multi-indicator assessment for sustainable health planning
Article References: Ramadan, R. H., Ramadan, M. S., Saleh, A. B., Elemam, A. A., Emam, M., & Khairy, N. (2026). Urban environmental vulnerability to lung cancer in greater Cairo: a GIS-based multi-indicator assessment for sustainable health planning. BMC Public Health. https://doi.org/10.1186/s12889-026-29985-4
Image Credits: AI Generated
DOI: 10.1186/s12889-026-29985-4
Keywords: lung cancer, GIS, Greater Cairo, spatial vulnerability, public health, environmental health, multi-criteria decision analysis, case-control study, Urban, environmental, vulnerability, lung
News Source: Nathaniel Bowman. (October 18, 2026). Mapping Cairo’s Lung Cancer Hotspots: How GIS Reveals Urban Vulnerability. Scienmag.