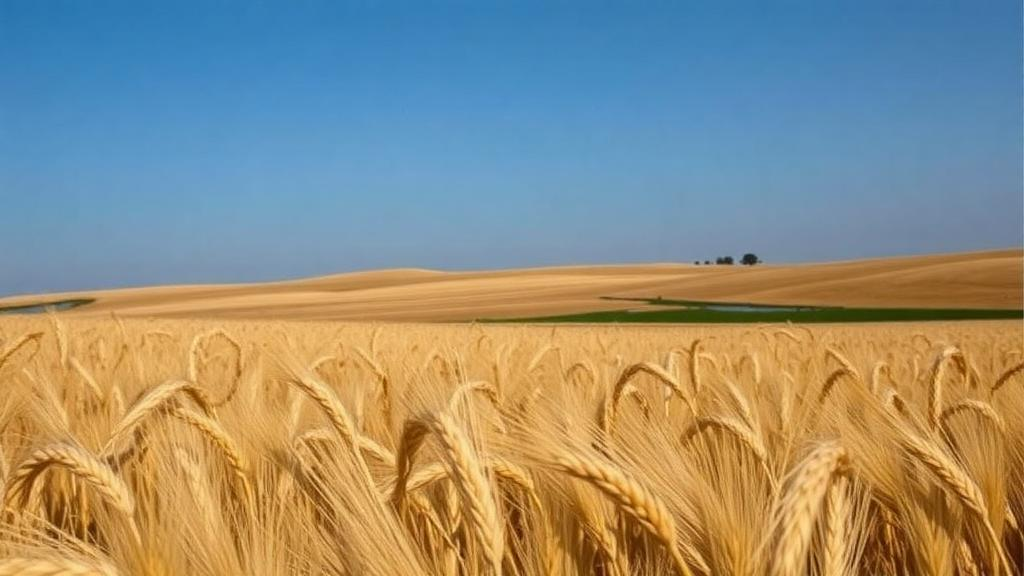
Nitrous oxide is not the most famous greenhouse gas, but it may be the most quietly devastating. With a 100-year warming potential 273 times that of carbon dioxide, and the added distinction of being the dominant ozone-depleting substance of the twenty-first century, this molecule escaping from fertilized soils punches far above its weight. Agriculture is the largest human source of it, and a new year-long study from a Swiss winter wheat field now offers something researchers have long lacked: a continuous, minute-by-minute account of exactly when and why those emissions happen. The answer, published in the journal Biogeosciences by Fabio Turco of ETH Zurich and colleagues, is that timing is everything, and the most dangerous moments are the ones farmers rarely watch.
The team measured nitrous oxide, carbon dioxide, and methane fluxes continuously above a 1.55-hectare cropland in Oensingen, canton of Solothurn, using the eddy covariance technique, a micrometeorological method that samples air at high frequency and integrates gas exchange over the entire field. The laser spectrometer and infrared gas analyzer mounted at the site captured half-hourly fluxes from September 2022 to October 2023, spanning the final month of a temporary grass-clover ley, the full winter wheat growing season, and a subsequent summer cover crop. This is, to the authors’ knowledge, the first study to report eddy covariance nitrous oxide fluxes over a complete winter wheat season, and the numbers it produced were sobering: cumulative emissions reached 5.5 kilograms of nitrous oxide nitrogen per hectare over the 282-day season, with yield-scaled emissions of 1.1 kilograms per tonne of grain, both figures well above values typically reported for wheat.
Raw flux data alone cannot explain why emissions spike when they do, so the researchers turned to machine learning. They trained an XGBoost model, a gradient-boosted tree ensemble, to predict nitrous oxide fluxes from a set of engineered predictors including soil temperature, water-filled pore space, precipitation, cumulative fertilizer nitrogen applied over the preceding 30 days, time since fertilization and soil preparation, and gross primary productivity, the ecosystem’s photosynthetic carbon uptake, which served as a proxy for crop activity and nitrogen demand. The model achieved an R-squared of 0.36 on an independent hold-out period, reproducing the timing of the main emission episodes even if it underestimated peak magnitudes. The real power came from interpreting the model with SHAP, or Shapley Additive exPlanations, a framework borrowed from game theory that decomposes every prediction into additive contributions from individual drivers.
The SHAP analysis did something no previous study had managed: it tracked, day by day, how the relative importance of each driver shifted across the cropping season. Over the full year, nitrogen fertilization was the dominant driver pushing emissions upward, accounting for 43 percent of all positive contributions, followed by soil moisture at 19 percent and gross primary productivity at 17 percent. But the temporal breakdown told a far richer story. During crop establishment in October 2022, when herbicide killed the grass-clover ley and winter wheat was direct-seeded, emissions were driven mainly by soil disturbance and low crop activity. Throughout winter, cold soils suppressed emissions, while low photosynthesis kept a persistent positive pressure on fluxes. In early spring, fertilization took over as the dominant force, with soil moisture amplifying the peaks.
Those spring peaks were dramatic. After the first fertilization events on 27 and 28 February, which supplied 111 kilograms of nitrogen per hectare as a mix of mineral ammonium nitrate and dairy slurry, fluxes surged in three distinct waves through March, peaking at a daily mean of 13.6 nanomoles per square meter per second on 12 March, with topsoil water-filled pore space above 80 percent. The critical insight is what was missing from the field at that moment: plants. Leaf area index was still below 1 square meter per square meter, and photosynthetic activity was minimal, meaning the crop could not yet absorb the nitrogen being poured into the soil. Soil mineral nitrogen climbed to 74 kilograms per hectare ten days after fertilization, an enormous microbial feast that wet, cool soil converted into nitrous oxide. By contrast, the smaller final application of 27 kilograms in early April, made when the canopy was already developed and nitrogen demand was high, produced only a modest emission pulse.
The study’s most elegant finding concerns what happened when the crop was growing hard. From mid-April to late May, when leaf area index rose from 2.5 to 4 and photosynthesis peaked, daily nitrous oxide fluxes fell to near zero despite warm soil and moisture levels above 60 percent throughout the profile. The SHAP dependence plot for gross primary productivity showed a clear shift from positive to negative contributions as productivity increased, revealing that active vegetation acts as a competing nitrogen sink, starving soil microbes of the substrate they need to produce the gas. Because soil moisture was already in the model, this effect cannot be explained away by transpiration drying the soil; it points to genuine substrate limitation, a plant-mediated brake on emissions that the authors interpret through the nitrogen synchrony framework, in which losses track the mismatch between nitrogen supply and crop demand.
To identify which microbes were actually making the gas, the team deployed static chambers and analyzed the stable isotope composition of the emitted nitrous oxide, focusing on site preference, the intramolecular distribution of nitrogen-15 within the molecule, which is largely independent of substrate composition and therefore a direct fingerprint of the production pathway. Combined with oxygen isotope ratios and a Monte Carlo mixing model called FRAME, the measurements showed that heterotrophic bacterial denitrification, possibly with nitrifier denitrification, dominated production, contributing 74 to 86 percent during the three weeks after fertilization. This made sense given the poorly drained silty clay soil, which kept water-filled pore space high and oxygen scarce. Intriguingly, the fraction of nitrous oxide further reduced to inert nitrogen gas rose from roughly 40 to 50 percent in the first week to about 78 percent by 17 March, suggesting that as conditions shifted, the microbial community became more thorough at finishing the job.
The greenhouse gas accounting added a further twist. Nitrous oxide emissions offset roughly 70 percent of the season’s net carbon dioxide uptake by the wheat, a far larger offset than the 10 to 12 percent reported for Swiss maize and pea in earlier eddy covariance work. When lateral carbon fluxes were included, the field emerged as a substantial net greenhouse gas source of 1349 grams of carbon dioxide equivalents per square meter, driven by the carbon exported in grain and straw. Even the fertilizer-free cover crop period emitted nitrous oxide at nearly the same daily rate as the wheat season, because post-harvest tillage and warm temperatures stimulated nitrogen mineralization while the slowly establishing crop could barely absorb it. Notably, the cover crop still halved post-harvest emissions compared with a year when the field was left bare, supporting Swiss policy that promotes continuous soil cover.
The practical implications are direct. The two most vulnerable windows, crop establishment and early spring, are both characterized by surplus soil mineral nitrogen meeting limited plant uptake under favorable moisture and temperature. Mitigation, the authors argue, should therefore focus on synchronizing nitrogen supply with demand: adjusted timing and split applications, site-specific and precision fertilization, enhanced-efficiency fertilizers, rapid soil cover after harvest, and avoiding the near-simultaneous application of mineral fertilizer and slurry, a combination that supplies both nitrate and easily degradable carbon to denitrifiers. Improving drainage on wet soils may also help by shortening the anaerobic episodes that favor denitrification. The XGBoost-SHAP framework itself is portable, requiring no site-specific parameterization, and the authors suggest coupling it with process-based biogeochemical models that could supply continuous simulated soil nitrogen as predictors. For a gas that has long evaded targeted control, the message is refreshingly concrete: it is not just how much nitrogen you apply, but when the crop is ready to use it.
Subject of Research: Temporal dynamics of nitrous oxide emission drivers and microbial sources in a fertilized winter wheat field
Article Title: What matters when? Temporal development of drivers and sources of nitrous oxide emissions in winter wheat
Article References: Turco, F., Feigenwinter, I., Allemann, L., Hörtnagl, L., Liebisch, F., & Buchmann, N. (2026). What matters when? Temporal development of drivers and sources of nitrous oxide emissions in winter wheat. Biogeosciences, 23(19), 7151-7182. https://doi.org/10.5194/bg-23-7151-2026
Image Credits: AI Generated
Keywords: nitrous oxide, winter wheat, eddy covariance, machine learning, SHAP, denitrification, stable isotopes, greenhouse gases, nitrogen fertilization, soil moisture, cropland, climate mitigation
News Source: Alan Morgan. (October 12, 2026). Machine learning reveals when wheat fields leak the most nitrous oxide. Scienmag.