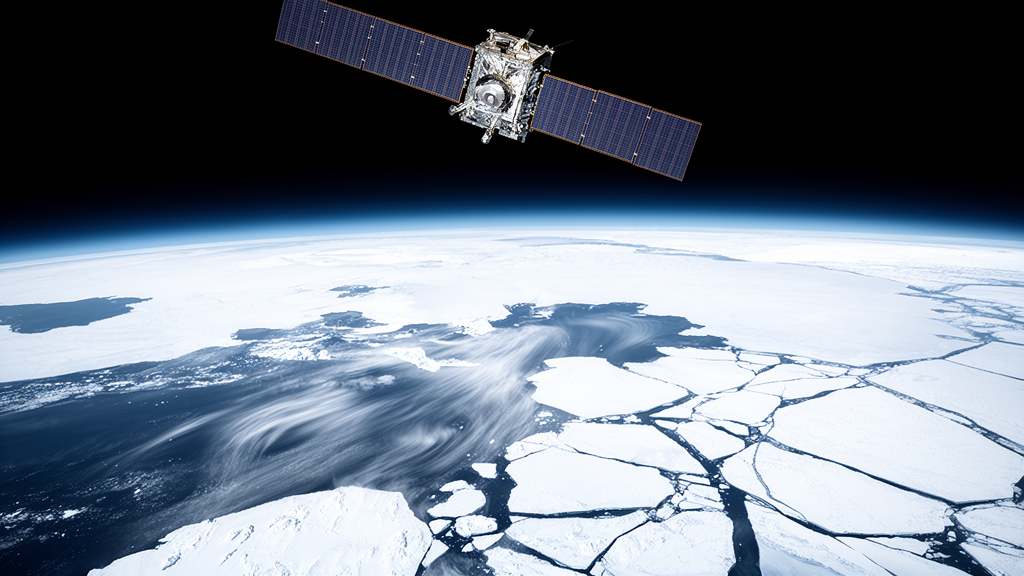
For more than four decades, scientists have tracked the drift of Antarctic sea ice from space, relying on passive microwave sensors to paint a continent-spanning picture of how the frozen skin of the Southern Ocean moves with winds and currents. That picture has just been put to one of its most rigorous tests yet. A team at the National Snow and Ice Data Center (NSIDC) at the University of Colorado Boulder, led by Younghyun Koo together with Walter N. Meier and J. Scott Stewart, has carried out a pan-Antarctic evaluation of the widely used NSIDC Polar Pathfinder daily sea ice motion product, and the verdict is sobering: the product systematically underestimates how fast the ice is actually moving, by roughly one kilometer per day across most of the Southern Ocean, with far larger errors near the ice edge.
The stakes could hardly be higher. Antarctic sea ice has recently lurched into uncharted territory, recording historic minima and a record-low maximum extent, a shift potentially driven by warming ocean waters and changing atmospheric circulation. Unlike its Arctic counterpart, Antarctic sea ice lives in an open-ocean environment, highly exposed to winds streaming off the continent, so its dynamics—how it moves, deforms, and disperses—are central to understanding its future. Yet while the Arctic benefits from a dense network of drifting buoys that anchor and correct satellite-derived motion fields, the Southern Ocean has only a sparse, mostly Weddell Sea-centered buoy fleet, leaving the Antarctic product to lean almost entirely on coarse passive microwave data.
Passive microwave instruments such as the Special Sensor Microwave/Imager and Sounder measure brightness temperatures at resolutions measured in tens of kilometers. The NSIDC product extracts motion from these images using a maximum cross-correlation technique: two consecutive daily images are compared within a search window, and the spatial offset that maximizes the correlation between brightness patterns is taken as the ice displacement. With fourfold oversampling, the effective sampling interval is about 6.25 kilometers, but the intrinsic footprint remains coarse, and the resulting motion field is noisy. To fill gaps and smooth the noise, the product applies an optimal interpolation scheme—a form of kriging in which each grid cell’s velocity is a distance-weighted average of nearby estimates, with a length scale of 417 kilometers.
In the Arctic, this interpolation is anchored by abundant, highly accurate buoy positions that receive the highest weights. In the Antarctic, with almost no buoys to lean on, the interpolated field rests on passive microwave estimates alone. The new study, published in the journal Earth Observation, set out to quantify just how much uncertainty that introduces. The team compared the product against two independent references: 99 drifting buoys deployed across the Southern Ocean between 2015 and 2023 as part of the International Programme for Antarctic Buoys, and a nine-year archive of high-resolution synthetic aperture radar (SAR) imagery from the Sentinel-1 satellites spanning 2015 to 2023.
The SAR reference was itself validated first. Using Sentinel-1 Extra Wide Swath images processed through the Google Earth Engine cloud platform, the researchers applied a motion retrieval algorithm developed at the Nansen Environmental and Remote Sensing Center, which combines feature tracking—identifying thousands of keypoints in each image pair—with a refined pattern-matching step that allows for rotation of the ice between acquisitions. Against the buoys, the SAR-derived drift achieved root mean square errors of 2.0 and 3.3 kilometers per day in the two velocity components, a mean speed difference of just 0.1 kilometers per day, and a mean angle difference of about minus six degrees. That level of agreement established SAR as a trustworthy, high-resolution yardstick for the entire Southern Ocean, far beyond the reach of the buoys.
The buoy comparison with the passive microwave product revealed the first red flag. The product’s root mean square errors reached 7.1 and 7.9 kilometers per day in the two components—dramatically larger than the roughly 2.9 kilometers per day reported for the Arctic version, a gap the authors attribute largely to the absence of buoy data in the Antarctic interpolation. More striking was the pattern of bias: drift direction was barely biased, with angle differences of only three to four degrees, but drift speed was consistently underestimated by two to three kilometers per day. And the error grew explosively as the ice thinned and broke apart. In regions with ice concentrations above 95 percent, the underestimation was about 1.5 kilometers per day; below 50 percent concentration, it ballooned to roughly 11.5 kilometers per day.
Extending the analysis pan-Antarctically with the SAR reference confirmed that this was not a Weddell Sea quirk. From March through November, across the Weddell Sea, Ross Sea, and Amundsen-Bellingshausen Seas, the passive microwave product underestimated SAR-derived speeds by 0.5 to 1.0 kilometers per day in every month of every year from 2015 to 2023. The bias was most pronounced in the eastern Weddell Sea and western Ross Sea, dynamic regions of fast-moving ice near the ice edge, where the shortfall reached about three kilometers per day. Direction, by contrast, held up well almost everywhere, with one persistent exception: a 10-to-20-degree clockwise rotation of the drift vectors in the eastern Weddell Sea.
The crucial clue came when the team stripped the interpolation out of the equation. Comparing the raw, un-interpolated passive microwave feature-tracking velocities against the same buoy and SAR references, the systematic speed bias essentially vanished—the raw product showed mean speed differences close to zero, and only about 0.6 kilometers per day of bias at high ice concentrations, with directional accuracy of four to five degrees. The conclusion is unambiguous: the maximum cross-correlation tracking itself does a respectable job of capturing ice speed, and it is the optimal interpolation step—the very process meant to clean up the product—that smooths away the true velocity, flattening high-speed gradients and, near the ice edge, filling in fast-moving marginal ice with slower values interpolated from the interior pack.
The spatial fingerprint of the error reinforces this interpretation. In all three sectors examined, the speed error grows sharply within about 200 kilometers of the ice edge, precisely where ice moves fastest and where interpolation from slower interior values does the most damage. Proximity to the Antarctic coastline, once the ice-edge effect was accounted for, did not significantly influence the uncertainty. A residual underestimation does remain in the raw product at low ice concentrations, where open-water emission contaminates the brightness temperature signal and blurs the spatial patterns the tracking algorithm depends on—but the dominant, continent-wide bias is a product of the processing pipeline, not the sensor physics.
For the research community, the message is practical and urgent. The NSIDC product does include uncertainty estimates tied to the interpolation, and the authors urge users—especially anyone studying ice-edge processes, sea ice mass budgets, or the response of Antarctic sea ice to its emerging new state—to take those uncertainties seriously in their analyses. Looking forward, the team recommends that future versions of the product fuse high-resolution velocity information from SAR imagery and the growing buoy record into the interpolation scheme, mitigating the smoothing and ice-edge biases that the current pipeline introduces. As Antarctic sea ice enters conditions the satellite record has never shown before, knowing not just where the ice goes, but how fast it gets there, has become a matter of record-keeping accuracy on a continental scale.
Subject of Research: Validation of the NSIDC passive microwave Antarctic sea ice drift product using Sentinel-1 SAR imagery and drifting buoy observations
Article Title: Pan-Antarctic evaluation of National Snow and Ice Data Center (NSIDC) sea ice drift product using high-resolution SAR and buoy data
Article References: Koo, Y., Meier, W. N., & Stewart, J. S. (2026). Pan-Antarctic evaluation of National Snow and Ice Data Center (NSIDC) sea ice drift product using high-resolution SAR and buoy data. Earth Observation, 1(1), 129-144. https://doi.org/10.5194/eo-1-129-2026
Image Credits: AI Generated
Keywords: Antarctic sea ice, sea ice drift, passive microwave, synthetic aperture radar, Sentinel-1, NSIDC, optimal interpolation, drifting buoys, Southern Ocean, marginal ice zone, remote sensing, sea ice velocity
News Source: Violet Maxwell. (October 9, 2026). Satellite Maps of Antarctic Sea Ice Motion Are Slower Than Reality, Study Finds. Scienmag.