Fit, Uncomplicated, and Indistinguishable: The Exercise Test Where Type 1 Diabetes Leaves No Trace
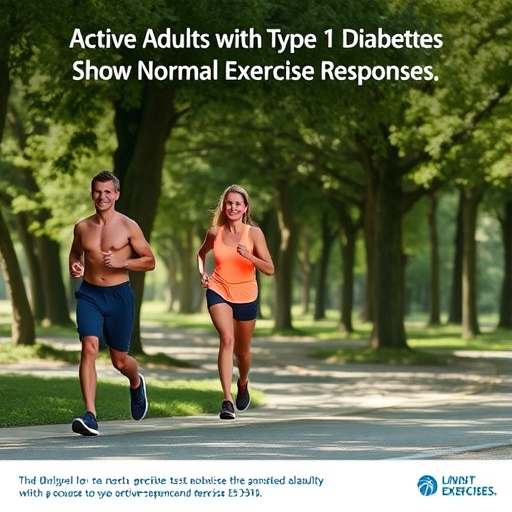
KUOPIO, Finland — For millions of people living with type 1 diabetes, one of the most persistent fears is invisible: the suspicion that somewhere inside the heart and lungs, the disease is quietly rewriting the rules long before symptoms appear. A new study from the University of Eastern Finland, published in Physiological Reports, now offers a striking counterpoint. When researchers drove physically active adults with long-standing but uncomplicated type 1 diabetes through a maximal cardiopulmonary exercise test, every conventional measure — oxygen uptake, ventilation, heart rate, stroke volume, cardiac output — traced the same physiological arc observed in meticulously matched healthy controls. From the first watt to the final gasp, the bodies of these adults with diabetes responded to escalating exercise like the bodies of people without it. For a disease that remains one of medicine’s most feared accelerators of cardiovascular disease, a result this clean is as unexpected as it is consequential.
The stakes reach far beyond the exercise laboratory. Type 1 diabetes arises when the immune system destroys the insulin-producing beta cells of the pancreas, committing patients to lifelong insulin therapy. Even under good metabolic control, cardiovascular disease remains a leading cause of death in this population, and the global prevalence and societal burden of the disease are climbing rapidly. Yet much of the prevention guidance these patients receive is extrapolated from studies of type 2 diabetes, a condition with fundamentally different machinery — insulin resistance rather than autoimmune beta-cell loss — and the Finnish team argues that borrowed evidence of this kind may not transfer cleanly. Their question was therefore sharply defined: strip away the neuropathy, nephropathy, retinopathy, hypertension, smoking, cardiovascular medication, and major comorbidities that confound most diabetes cohorts, and does uncomplicated type 1 diabetes itself leave any measurable imprint on how the heart, lungs, and circulation perform under maximal physiological stress?
Earlier research gave that question real teeth. Cardiopulmonary exercise testing, or CPET, is physiology’s most integrated stress probe: with a subject on a cycle ergometer, it captures breath-by-breath gas exchange, ventilatory patterns, and — in this study — noninvasive cardiac function as workload climbs. Previous studies had reported lower maximal oxygen uptake in type 1 diabetes, blunted oxygen pulse, reduced tidal volume and expiratory flow at peak exercise, and a heart-rate curve that rises almost linearly with workload instead of the normal inverted pattern in which heart rate surges at low intensity and then flattens toward maximum. That linear signature has been interpreted as a possible fingerprint of diabetes-related myocardial change, and it has appeared even in patients without long-term complications. But the literature is riddled with inconsistencies: some cohorts show lower oxygen uptake, others show none, and glycated hemoglobin alone cannot explain the scatter of results. Most tellingly, earlier work rarely tracked stroke volume — the volume of blood ejected with each heartbeat and the true engine of cardiac output — leaving the central hemodynamic story unresolved.
The answer came from the DIAMES project — Effects of Exercise and Stress on Glucose Metabolism in Type 1 Diabetes — conducted between 2021 and 2022 under approval from the ethics committee of the Northern Savo Hospital District. Fifty-three volunteers began; after excluding three participants with diabetes who used hypertension medication and two controls whose electrocardiograms were too corrupted for reliable heart-rate analysis, the final cohort comprised 15 adults with uncomplicated type 1 diabetes and 33 controls matched for age, sex, height, and body mass index. The screening was deliberately ruthless: no neuropathy, nephropathy, or retinopathy; no asthma, hypertension, or coronary disease; no renal insufficiency, pacemaker, or cardiovascular medication; no smoking. The participants with diabetes had lived with the condition for an average of fifteen years and maintained an average HbA1c of 57.9 mmol/mol — roughly 7.5 percent — with half managed by insulin pump and half by multiple daily injections. All were physically active, and total weekly exercise did not differ between the groups.
On test days, participants arrived at the university’s HUMEA laboratory between seven in the morning and two in the afternoon, having abstained from alcohol, caffeine, and tobacco for twelve hours and from intense training for twenty-four. Blood glucose was confirmed to sit between 5 and 13.9 mmol/L before the protocol and was monitored by finger-prick throughout, in line with international standards for exercise in diabetes. The test itself was an incremental cycling CPET: three minutes of seated rest, then three-minute stages of increasing power, rising by 35 watts per stage for men and 25 watts for women — sex-specific scaling designed to yield a fatigue-limited finish in roughly eight to twelve minutes, so that cardiopulmonary limits rather than exhausted quadriceps would decide the endpoint. Expired gases were measured breath by breath with a calibrated portable spiroergometer while a two-lead electrocardiogram sampled at 2,000 hertz tracked every beat. The methodological centerpiece was impedance cardiography, which estimates stroke volume noninvasively from beat-to-beat changes in thoracic electrical impedance as each contraction ejects blood — a technique validated against the direct Fick method at rest and during dynamic exercise. Peak effort was verified by heart rates beyond 95 percent of predicted maximum, respiratory exchange ratios above 1.1, or a plateau in oxygen uptake.
Rather than reducing each person to a single peak number, the researchers dissected the entire response at four physiological checkpoints: rest, the first ventilatory threshold (VT1), the second ventilatory threshold (VT2), and peak effort. VT1 marks the onset of lactate accumulation, when ventilation begins rising to expel the additional carbon dioxide released as bicarbonate buffers the approaching acidosis; VT2 signals the steep second acceleration as the body nears its anaerobic limit. A sports medicine physician identified the thresholds using the modified V-slope method, ventilatory-equivalent curves, the slope of ventilation against carbon dioxide output, and end-tidal carbon dioxide trends, with the respiratory exchange ratio as supporting context. Peak values were extracted from 30-second moving averages of breath-by-breath data and ensemble averages of roughly a dozen heartbeats within the same epochs. Linear mixed-effects models then tested group, stage, and group-by-stage interaction effects for every variable, treating stage as a repeated factor within subjects under an autoregressive covariance structure. The interaction term is the decisive statistic: it asks whether the shape of the response across the whole exercise trajectory differs between groups — a far more demanding test than comparing isolated peaks.
The pulmonary verdict was uniform. Work rate, relative and absolute oxygen uptake, minute ventilation, tidal volume, breathing frequency, the ventilatory equivalents for oxygen and carbon dioxide, carbon dioxide production, end-tidal carbon dioxide pressure, and respiratory exchange ratio all advanced in lockstep across the four stages in both groups, exactly as exercise physiology dictates. Minute ventilation climbed from roughly 12 liters per minute at rest to well over 120 at peak, end-tidal carbon dioxide crested near the first threshold before falling as hyperventilation took over, and the respiratory exchange ratio crossed 1.1 at exhaustion in both groups. Every Stage effect was highly significant; not a single Group effect or Group × Stage interaction reached — or even approached — significance. At maximal effort, the diabetes group sustained an estimated 218 watts against the controls’ 235, ventilated 122 liters of air per minute against 130, and consumed 39.5 milliliters of oxygen per kilogram per minute against 41.3 — margins so narrow the models could not distinguish them from chance.
The cardiovascular data carried the deeper revelation, because stroke volume was tracked directly. Heart rate climbed from the high seventies or low eighties at rest to the mid-180s at peak in both groups, with no detectable difference at any stage. Stroke volume surged from about 83 milliliters at rest to roughly 109–116 by the first ventilatory threshold, then settled into the textbook plateau while heart rate carried the remaining load toward a cardiac output approaching 21 liters per minute. As heart rate accelerated, left ventricular ejection time shortened by roughly 50 milliseconds, compressing the filling window — and the heart compensated, as healthy recreationally active hearts do, by contracting more forcefully to hold stroke volume steady. End-diastolic volume drifted only modestly, ejection fraction rose to the mid-70s before easing slightly, and systemic vascular resistance collapsed from above 2,000 to under 720 indexed units as working muscle demanded perfusion. Oxygen pulse, the gas-exchange surrogate that multiplies stroke volume by the arterial-venous oxygen difference, followed the same path in both groups — textbook physiology, indistinguishable between the arms of the study.
Set against earlier literature, the result marks a clean break. Pooled analyses had reported lower maximal oxygen uptake and reduced oxygen pulse in type 1 diabetes, alongside that suspiciously linear heart-rate curve; a male-only study of uncomplicated patients attributed the pattern to dysregulated cardiac contractility; and a classic 1990s study that did measure stroke volume documented wildly heterogeneous responses in long-term patients, some unable to sustain the early rise at all. The Finnish data sit at the opposite pole: a stroke-volume plateau indistinguishable from controls, heart-rate trajectories without statistical deviation, and a hemodynamic pattern reproducing the classic physiology of the recreationally active heart. The discrepancy, the authors argue, likely reflects cohort composition rather than contradiction — earlier studies folded in people with complications, overweight, recent-onset disease, lower glycemic control, or unreported activity levels. Their result also echoes an earlier Finnish trial in which a year of unsupervised individualized training raised peak oxygen uptake and oxygen pulse equally in patients and controls, despite no improvement in glycemic control — evidence that the capacity to adapt to training is preserved.
The authors are emphatic about what this null result cannot prove. Fifteen participants with diabetes is a small group, and with unequal arms the study had limited power to detect subtle effects; an absence of detectable differences under these conditions is not evidence of physiological equivalence. Blood pressure was not recorded during exercise, recovery metrics fell outside this analysis, and autonomic responses went unmeasured — consequential omissions, because companion studies from the same cohort have already surfaced quiet anomalies: orthostatic testing revealed subtly elevated systolic blood pressure and heightened sympathetic activation in these same volunteers, and a parallel paper found attenuated fast heart-rate recovery after peak effort, hinting at delayed parasympathetic reactivation even in clinically pristine patients. The self-reported activity data carry their own caution: a Mann–Whitney U test flagged a difference in weekly light-intensity activity frequency at p = 0.028, but the Hodges–Lehmann median estimate dissolved once its 95 percent confidence interval embraced zero, and because some participants reported more than one intensity on the same day, the counts were not capped at seven days. Larger studies with prospective power calculations, heart-rate variability measured during exercise, blood pressure monitoring, and continuous glucose metrics such as time in range are the next frontier. Until then, the message for active adults whose diabetes has spared their vessels, nerves, eyes, and kidneys is quietly striking: driven to its physiological ceiling, the uncomplicated diabetic heart performs like anyone else’s.
Subject of Research: Cardiopulmonary and cardiovascular exercise responses in physically active adults with uncomplicated type 1 diabetes compared with matched healthy controls during incremental cardiopulmonary exercise testing.
Subject of Research: Medicine
Article Title: Physically active adults with uncomplicated type 1 diabetes exhibit normal cardiopulmonary exercise test responses versus healthy controls
Article References: Sorola, S., Eronen, T., Hyrylä, V., Kupari, S., Venojärvi, M., Tikkanen, H., Tarvainen, M., & Lindholm, H. (2026). Physically active adults with uncomplicated type 1 diabetes exhibit normal cardiopulmonary exercise test responses versus healthy controls. Physiological Reports, 14(13), Article e70997. https://doi.org/10.14814/phy2.70997
Image Credits: AI Generated
DOI: 10.14814/phy2.70997
Keywords: type 1 diabetes, cardiopulmonary exercise testing, stroke volume, ventilatory threshold, oxygen uptake, cardiac output, impedance cardiography, cardiorespiratory fitness, uncomplicated diabetes, exercise physiology
Cite Scienmag News
APA MLA Chicago
Ophelia Keating. (August 30, 2026). Active Adults with Type 1 Diabetes Show Normal Exercise Test Responses. Scienmag. https://scienmag.com/active-adults-with-type-1-diabetes-show-normal-exercise-test-responses/
Ophelia Keating. “Active Adults with Type 1 Diabetes Show Normal Exercise Test Responses.” Scienmag, 30 August 2026, https://scienmag.com/active-adults-with-type-1-diabetes-show-normal-exercise-test-responses/. Accessed 30 August 2026.
Ophelia Keating. “Active Adults with Type 1 Diabetes Show Normal Exercise Test Responses.” Scienmag. August 30, 2026. https://scienmag.com/active-adults-with-type-1-diabetes-show-normal-exercise-test-responses/
Copy citation Download RIS
Tags: cardiopulmonary exercise testing in diabetescardiovascular health in type 1 diabetescardiovascular risk assessment in type 1 diabetesdiabetes and cardiovascular disease riskdiabetes research and exercise performanceeffects of long-standing type 1 diabetes on heart and lung functionexercise response in adults with type 1 diabetesexercise testing outcomes in uncomplicated type 1 diabetesexercise tolerance in adults with type 1 diabeteshealthy aging with type 1 diabetesimmune system and pancreatic beta cell destructionimmune system impact on heart and lungsimpact of diabetes on heart rate and cardiac output during exerciseimplications for exercise guidelines in diabeticsinsulin therapy and exercise toleranceinsulin therapy and physical activitylong-term diabetes managementphysical activity and diabetes managementphysiological responses to exercise in diabetesphysiological responses to exercise in diabetic patientsType 1 diabetes and cardiovascular healthType 1 diabetes exercise response