Model developed by Brazilian researchers predicts spatial and temporal evolution of epidemic diseases and can help plan more effective social isolation programs with less socio-economic impact.
Credit: Airton Deppman
By José Tadeu Arantes | Agência FAPESP – The most widely used model to describe the epidemic evolution of a disease over time is called SIR, short for susceptible (S), infected (I), and removed (R). A susceptible person can be infected, and the infected person will eventually be removed owing to either immunization or death. The number of people in each class varies, whereas the total population, given by the sum of individuals in all three classes, is considered constant in the time scale of epidemic contamination.
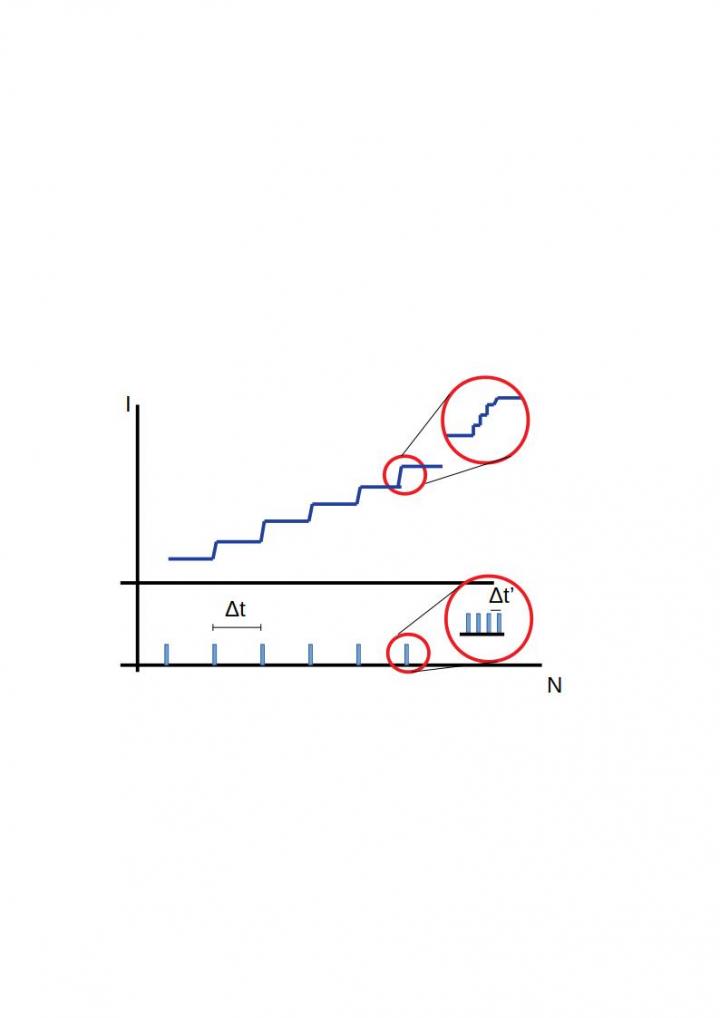
The function I(t) resulting from the model describes the increase in the number of infected people over time. The curve rises sharply during the phase in which the pathogen is spreading quickly, peaking at maximum contamination, and sloping down more gently as contagion slowly decreases until there are no longer any infectious people. The SIR model has been applied in several studies of the COVID-19 pandemic.
“Although this model is a very useful tool to investigate the temporal evolution of the pandemic, it provides few insights into how contagion progresses spatially, which is key to the planning of social distancing programs that effectively protect people and at the same time reduce the socio-economic impact of the disease,” Airton Deppman, a professor in the University of São Paulo’s Physics Institute (IF-USP), told Agência FAPESP.
Deppman is one of the authors of a paper published in the journal Chaos, Solitons & Fractals reporting some of the findings.
The study was supported by FAPESP via a Thematic Project for which Arnaldo Gammal is principal investigator and Deppman is one of several co-principal investigators.
The results point to the fractal nature of transmission in the case of COVID-19, as is also the case for many other variables relating to social life. This means contagion occurs discontinuously but in accordance with the same pattern at different scales. An infected person initially transmits the virus to a relatively small group with which he or she is in direct contact. Then there is a gap in transmission, followed by another phase in which the initially infected group transmits the virus to a larger group, and so on.
“When you construct a graph crossing the number of infected people with the population and quantify the variables on a logarithmic scale on the x and y axes, the result is a straight line. This is typical of a fractal phenomenon, in which the same pattern is repeated at various scales,” Deppman explained.
The study investigated this spatial distribution using data for China, the United States, and the state of São Paulo and tested the results by comparing the data for São Paulo and Europe. “The model successfully described in great detail the temporal evolution of contagion,” Deppman said. “As a rule of thumb, the curve rises steeply at first, and this is followed by smaller peaks and troughs as the virus is transmitted from one area to the next.”
The model can be used to find an optimal point at which to begin and end isolation, which should happen region by region and not generically for an entire state or country, he concluded.
The article “Fractal signatures of the COVID-19 spread” can be read at: www.sciencedirect.com/science/article/pii/S0960077920305166?via%3Dihub#!.
Media Contact
Heloisa Reinert
[email protected]
Original Source
https:/
Related Journal Article
http://dx.
