Chinese researchers have built the first three-dimensional model of breast aging that combines both age and body mass index, using scans from 305 women aged 20 to 70 with BMIs ranging from 16.1 to 36.9 kg/m². The work, published in the journal Fashion and Textiles, offers the fashion industry a data-driven alternative to sizing systems that still rely largely on standardized young women’s bodies and simple bust and underbust measurements.
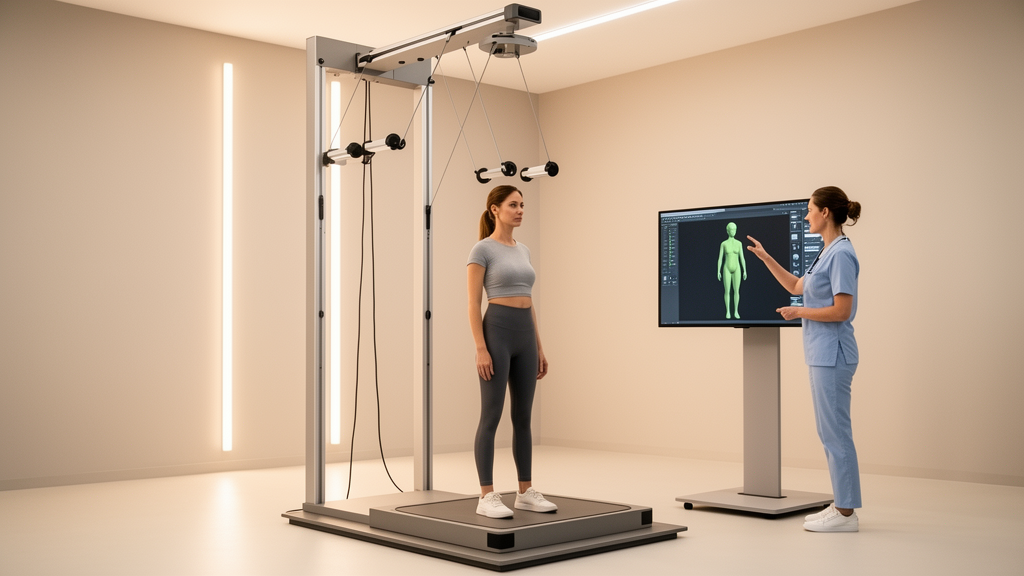
The team, led by Xingzhi Shi, Zixu Cai, Jie Zhang and Yadie Yang, scanned volunteers with a portable 3D scanner accurate to 0.02 mm at a working distance of 60 mm. Five women who had undergone previous breast surgery were excluded from the original 310 participants, leaving 305 healthy subjects divided into ten age groups of roughly 30 women each. Participants stood upright in an A-pose with arms relaxed at 30 to 45 degrees from the torso, their waist and abdominal areas exposed, while the rotating platform captured the torso surface. The survey ran between 2024 and 2025 with approval from Hong Kong Polytechnic University, and all data were anonymized before analysis.
To turn raw scans into a usable statistical shape model, the researchers first established dense correspondence between each scan and a template mesh of 12,167 vertices and 22,768 triangles using a non-rigid iterative closest point algorithm. They then applied generalized Procrustes alignment to remove non-shape differences such as translation and rotation, ensuring that subsequent analysis focused purely on shape. Principal component analysis then decomposed the shape distribution into orthogonal directions of maximal variance. The first five components together explained 87.53 percent of total variation, with the first component alone accounting for 60.18 percent, followed by 11.47, 9.82, 3.50 and 2.56 percent for components two through five. The first 18 components explained 95 percent of total variance, and a model built on them reconstructed scans with an average mesh error of 3.470, plus or minus 0.571, millimeters.
The first principal component represents the overall size of the female torso. Bust girth, underbust girth, breast width, bust point distance and sternal notch-to-nipple distance all correlated strongly with it, with coefficients of 0.905, 0.908, 0.904, 0.72 and 0.792 respectively. The second component captures whether breasts appear lifted and firm or sagging, along with secondary changes such as forward-leaning posture and narrower shoulders. According to Pearson correlation analysis, the first component showed a strong positive correlation with both age (r = 0.586, p < 0.001) and BMI (r = 0.825, p < 0.001), while the second component correlated negatively with age (r = −0.537, p < 0.001) and positively with BMI (r = 0.326, p < 0.001). In plain terms, as women in this dataset grew older or heavier, overall breast size increased in the direction captured by the first component, while aging reduced the fullness captured by the second and higher BMI partly offset that trend.
Modeling the aging trajectory itself required a method capable of handling nonlinear relationships. Traditional linear regression has been used to study changes in bones, feet and ears, but the authors argue it often fails to capture complex patterns in soft tissue. They instead employed a Gaussian kernel-based locally weighted partial least squares regression, or LW-PLSR, which emphasizes samples most similar to a target age and BMI combination by assigning them higher weights. The proximity between subjects was measured with Mahalanobis distance, which corrects for scale differences and correlation between age and BMI. Bandwidth, the parameter controlling the trade-off between sensitivity to local variation and generalization, was optimized through leave-one-out cross-validation across candidate values from 0.1 to 2.55, minimizing the mean absolute error of predicted shapes while maintaining smoothness.
The resulting aging patterns reveal how breast geometry shifts across the lifespan at different body sizes. From age 20 to 25 at BMIs of 23 and 25, the models show a slight reduction at the lower pole of the breast. Between ages 25 and 35, women at every BMI except 30 exhibit moderate involution of the lower pole, a change the authors link to mammary gland involution associated with parity and lactation. At a BMI of 25, this moderate lower-pole involution persists until roughly age 40. Involution of the upper pole appears later as BMI rises: at a BMI of 18.5 it becomes evident around age 50, while at BMIs of 23, 25 and 30 it emerges at approximately ages 55, 60 and 70 respectively. At a BMI of 30, the greater proportion of adipose tissue makes age-related involution relatively less obvious than at lower BMI levels.
Key measurements tell a complementary story. With increasing age, bust contour girth, underbust girth, bust width and the distance from the suprasternal notch to the bust point generally increase, while the distance between the bust points generally decreases. At a BMI of 18.5, where adipose tissue is scarcer, measurements fluctuate more with age and bust width actually trends downward, with minor turning points near ages 30 and 50 that the authors associate with involution from breastfeeding and childbirth around 30 and with aging around 50. Across the same age, higher BMI consistently produced larger breasts with a more outward lower pole. The authors also note that beyond soft-tissue changes, the thorax develops greater forward convexity and the spine becomes more kyphotic with age, skeletal shifts that contribute to larger bust and underbust girths in older women.
The practical implications reach well beyond academia. Existing sizing systems and reference databases are largely built on young female body data, with limited representation of middle-aged and older women, a gap the authors say increases material waste and return rates in online apparel shopping while leaving consumers with discomfort, diminished confidence and even long-term musculoskeletal issues. Because the first principal component is strongly correlated with the measurements that define bra and garment sizing, the mean shape and that component can inform size ranges for target user groups. The first two components could enable mass customization of bras, garments and related products, following approaches already used for head and face products, while bespoke models trained on subsets of the data could serve specific ptosis grades or breast volume categories and eventually feed virtual try-on systems and digital manikins, which remain predominantly constructed from Caucasian populations.
The authors are careful about the study’s limits. The data are cross-sectional rather than longitudinal, so the model captures average population trends rather than any individual’s aging trajectory, and age is only an approximation of biological aging since breasts change at different rates in different women. Roughly 30 participants per age decade is a modest sample, parity, menopause and breastfeeding effects were not excluded, and the BMI distribution, though roughly normal, was not uniform, with sparse coverage at the low and high extremes. The observed pattern at underweight BMIs, where overall volume rises slightly from age 20 to 25 before more drastic involution between 25 and 30, needs further validation, as does the difference between ages 20 and 25 more broadly. Cultural norms and privacy concerns that make 3D breast data scarce also constrain how much larger such datasets can grow. Still, the framework gives manufacturers, designers and researchers an objective anthropometric foundation for sizing, mass customization and functional fit analysis, and the authors suggest it could be extended to model breast aging patterns in other racial and ethnic groups for ergonomic fashion design worldwide.
Subject of Research: 3D statistical shape modeling of age- and BMI-related breast morphology in Chinese women for ergonomic fashion design
Article Title: 3D female breasts aging patterns integrating age and BMI for ergonomic fashion design
Article References: Shi, X., Cai, Z., Zhang, J., & Yang, Y. (2026). 3D female breasts aging patterns integrating age and BMI for ergonomic fashion design. Fashion and Textiles, 13(1), Article 25. https://doi.org/10.1186/s40691-026-00474-x
Image Credits: AI Generated
DOI: 10.1186/s40691-026-00474-x
Keywords: 3D scanning, breast morphology, body mass index, statistical shape model, ergonomic fashion design, sizing systems, principal component analysis, locally weighted regression, aging patterns, apparel fit, Chinese women, anthropometry
News Source: Denise Maddox. (October 30, 2026). 3D scans map how age and BMI reshape women’s breasts for better-fitting fashion. Scienmag.