Credit: Jean-Gabriel Young
Two family members test positive for COVID-19 — how do we know who infected whom? In a perfect world, network science could provide a probable answer to such questions. It could also tell archaeologists how a shard of Greek pottery came to be found in Egypt, or help evolutionary biologists understand how a long-extinct ancestor metabolized proteins.
As the world is, scientists rarely have the historical data they need to see exactly how nodes in a network became connected. But a new paper published in Physical Review Letters offers hope for reconstructing the missing information, using a new method to evaluate the rules that generate network models.
“Network models are like impressionistic pictures of the data,” says physicist George Cantwell, one of the study’s authors and a postdoctoral researcher at the Santa Fe Institute. “And there have been a number of debates about whether the real networks look enough like these models for the models to be good or useful.”
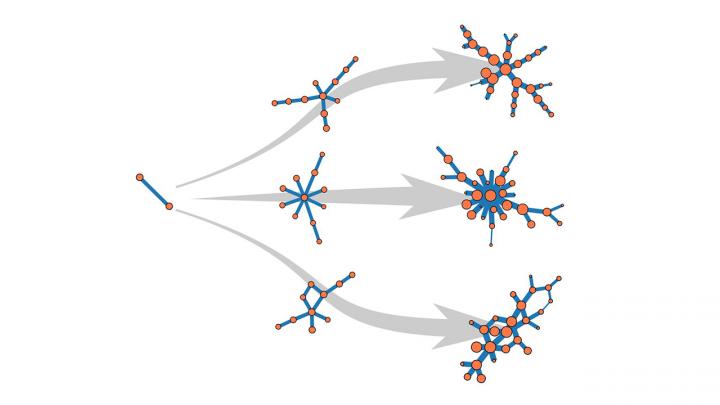
Normally when researchers try to model a growing network — say, a group of individuals infected with a virus — they build up the model network from scratch, following a set of mathematical instructions to add a few nodes at a time. Each node could represent an infected individual, and each edge a connection between those individuals. When the clusters of nodes in the model resemble the data drawn from the real-world cases, the model is considered to be representative — a problematic assumption when the same pattern can result from different sets of instructions.
Cantwell and co-authors Guillaume St-Onge (University Laval, Quebec) and Jean-Gabriel Young (University of Vermont) wanted to bring a shot of statistical rigor to the modeling process. Instead of comparing features from a snapshot of the network model against the features from the real-world data, they developed methods to calculate the probability of each possible history for a growing network. Given competing sets of rules, which could represent real-world processes such as contact, droplet, or airborne transmission, the authors can apply their new tool to determine the probability of specific rules resulting in the observed pattern.
“Instead of just asking ‘does this picture look more like the real thing?'” Cantwell says, “We can now ask material questions like, ‘did it grow by these rules?'” Once the most likely network model is found, it can be rewound to answer questions such as who was infected first.
In their current paper, the authors demonstrate their algorithm on three simple networks that correspond to previously-documented datasets with known histories. They are now working to apply the tool to more complicated networks, which could find applications across any number of complex systems.
###
Media Contact
J Marshall
[email protected]
Related Journal Article
http://dx.


