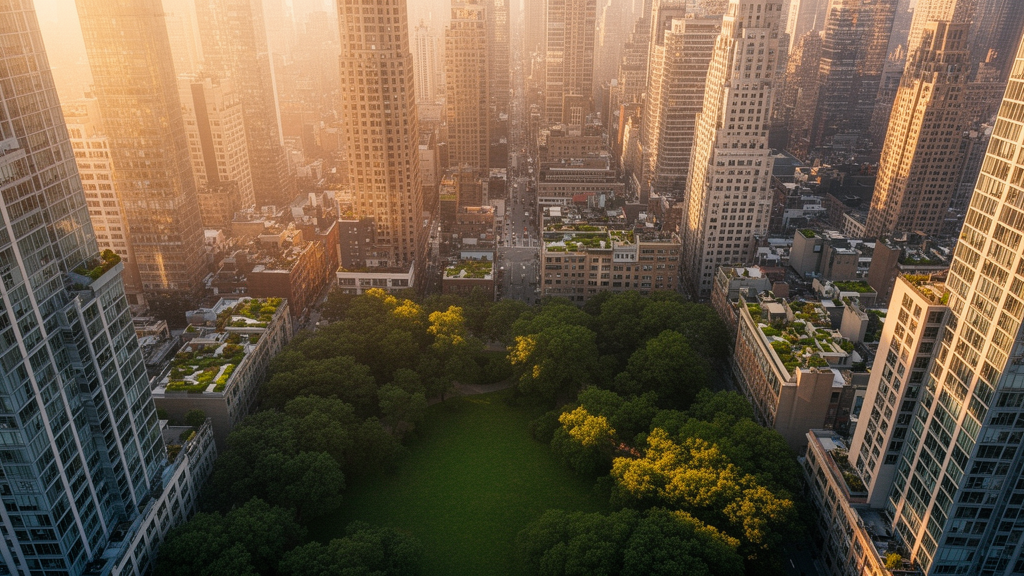
Across more than 10,000 urban centres worldwide, one feature of the built environment stands out above every other predictor of how green a city is: the average height of its buildings. A new study published in City and Built Environment analysed harmonised satellite-derived data from the Global Human Settlement Layer Urban Centres Database and found that lower-rise urban forms are consistently associated with more green space, while greater built-up height goes hand in hand with less. The result held whether researchers measured the share of residents living near highly vegetated areas, the share of high-greenness area within the built-up fabric, or the overall share of green area in built-up space.
The study, led by Alberto Gianoli and published on 29 July 2026, combined three machine-learning methods in a single analytical pipeline. Extreme Gradient Boosting, or XGBoost, was used to model the nonlinear relationships among 131 predictors drawn from climate, socio-economic, demographic, geographic and urban-form variables. SHAP values, borrowed from cooperative game theory, then attributed each model’s predictions to individual features, revealing both the importance of each variable and the direction of its effect. Finally, Double Machine Learning was applied to estimate the conditional effect of a single treatment variable, average built-up height in 2020, while flexibly adjusting for a high-dimensional set of confounders measured at or before that year.
The three outcomes examined were conceptually distinct. The first, SD_POP_HGR_2025, measured the share of each urban centre’s population living in areas classified as high greenness, capturing exposure to highly vegetated environments. The second, GR_SHB_HGR_2025, measured the share of built-up area located within high-greenness zones, capturing the concentration of dense vegetation within the urban fabric. The third, GR_SHB_GRN_2025, measured the overall share of green area within built-up area. High greenness was defined using a three-year average NDVI mask applied within a 300-metre buffer of built-up cells, so the indicators reflect proximity to high-NDVI vegetation rather than access to public parks.
Predictive performance was strong across all three models, with out-of-sample coefficients of determination ranging from 0.66 to 0.89. The population-exposure model reached an R² of approximately 0.66, while the two area-based measures achieved 0.70 and 0.89 respectively. Lower errors for the area-based outcomes reflect the tighter, more structurally constrained distribution of those measures, whereas population exposure is more dispersed and context-dependent. Benchmarking against Random Forest, LightGBM, CatBoost and a multilayer perceptron confirmed that gradient boosting was the right choice: the three tree ensembles were nearly indistinguishable, with mean R² values of 0.77, 0.77 and 0.76, while the neural network lagged far behind at 0.16.
The SHAP dependence plots revealed a strongly nonlinear and predominantly negative relationship between average built-up height and every greenness outcome. At low building heights, roughly two to four metres, SHAP values were strongly positive, indicating that low-rise environments are associated with higher predicted greenness. Above roughly six to eight metres, fitted SHAP values turned consistently negative. For the two area-based outcomes the decline was steeper and more uniform than for population exposure, suggesting that vertical development constrains not only where people live relative to green space but also the physical capacity of the built fabric to accommodate vegetation. The fitted curves flattened at greater heights rather than showing a discrete threshold, and the narrow dispersion at high vertical density points to a structural ceiling on green coverage.
Double Machine Learning then tested whether the association survives after residualising both treatment and outcome against a rich set of observed confounders. For the population-based outcome, a one-metre increase in average built-up height was associated with a 0.66 percentage-point decrease in the share of residents living in high green areas (coefficient −0.656, standard error 0.164, p < 0.001). For the share of high green area in built-up area, the estimate was a 0.23 percentage-point decrease per metre (coefficient −0.229, standard error 0.023, p < 0.001), and for overall green share a 0.35 percentage-point decrease (coefficient −0.349, standard error 0.021, p < 0.001). In all three models the confidence intervals lay entirely below zero, and robustness checks using alternative sample splits, ten-fold cross-fitting and different nuisance learners preserved the sign and magnitude of the effect.
Formal sensitivity analysis, following the framework of Chernozhukov and colleagues, quantified how strong an unobserved confounder would need to be to overturn each result. For the two area-based outcomes the robustness values were 12.5 per cent and 7.3 per cent, well above the treatment-side strengths implied by observed benchmarks such as macro-region (approximately 2.0 per cent) and GDP (approximately 4.3 per cent). The population-exposure effect, by contrast, had a robustness value of only 3.8 per cent, with 2.3 per cent sufficient to render it statistically insignificant, below the strength implied by GDP. The authors therefore describe the physical relationship between vertical form and green cover as robust, while the effect on where people live relative to green areas is fragile and should be interpreted with caution.
Heterogeneity analyses sharpened the picture further. Stratifying by World Bank income group, the negative effect on area-based greenness was present in every income category but varied substantially in magnitude: weakest in high-income cities, where a one-unit increase in built-up height corresponded to a 0.064 percentage-point decrease in high-green share and a 0.143 percentage-point decrease in overall green share, and strongest in lower-middle-income cities, where the corresponding estimates were −0.423 and −0.542 percentage points and the population-exposure effect reached −1.757 percentage points, the only income group where that outcome was statistically significant. Stratifying by macro-region, the area-based effects were negative and significant in all regions except Northern America, with the largest coefficients in Central and Southern Asia (−0.551 for overall green share) and Sub-Saharan Africa (−0.490). Northern America, with only 396 urban centres, produced wide confidence intervals and no statistically significant estimates.
Grouped validation tests confirmed that the area-based relationship generalises across world regions while the exposure relationship does not. Under leave-one-macro-region-out cross-validation, overall green share retained an R² of 0.81 against 0.90 on a random split, but high-green share fell to 0.45 and population exposure to 0.25, indicating that the apparent predictive performance of the exposure model under random splitting reflected largely spatial structure rather than transferable signal. When DML was re-estimated with cluster-aware cross-fitting and standard errors clustered by country across 185 clusters, the two area-based effects remained negative and highly significant and grew somewhat larger in magnitude, while the population-exposure estimate became imprecise and unstable.
The authors stress that the estimates are conditional causal effects under an observed-confounding assumption, not evidence of a simple policy lever. Average built-up height is a structural characteristic that co-varies with compactness, land scarcity, imperviousness and development intensity, so the DML coefficient captures the influence of a broader vertical urban-form syndrome rather than height alone. Measurement error in the remote-sensing products, including a global RMSE of five to six metres for built-up height and the known limitations of NDVI-based greenness, means the estimates are more likely to understate than overstate true magnitudes. The central policy implication is that density and greenness can coexist only by design: greenness-sensitive densification, open-space ratios, green-factor requirements, street trees and distributed pocket parks can decouple vertical growth from vegetation loss, and the trade-off is weakest precisely where planning capacity is strongest.
Subject of Research: Predictors of urban greenness across more than 10,000 global urban centres using XGBoost, SHAP and Double Machine Learning
Article Title: Predictors of urban green areas globally using explainable and double machine learning
Article References: Gianoli, A. (2026). Predictors of urban green areas globally using explainable and double machine learning. City and Built Environment, 4(1), Article 17. https://doi.org/10.1007/s44213-026-00083-w
Image Credits: AI Generated
DOI: 10.1007/s44213-026-00083-w
Keywords: urban greenness, built-up height, XGBoost, SHAP, Double Machine Learning, GHS-UCDB, NDVI, urban form, densification, population exposure, green-space provision, global urban centres
News Source: Denise Maddox. (October 28, 2026). Taller cities are greener cities’ worst enemy, global study of 10,000 urban centres finds. Scienmag.