SDSS Data Release 20 Maps the Southern Sky in Unprecedented Detail
The Sloan Digital Sky Survey has released Data Release 20, a major expansion of its ongoing fifth-generation campaign to map the Universe across space, time, and wavelength. The release combines more than three million optical spectra with new observations from both hemispheres, including the first Southern Hemisphere spectra obtained by the BOSS spectrograph in the SDSS-V era. Together, the data provide an exceptionally broad view of stars, galaxies, black holes, interstellar gas, and the large-scale structure of the cosmos.
Unlike a conventional astronomical image, a spectrum records how an object emits, absorbs, and scatters light across a range of wavelengths. These patterns reveal chemical composition, temperature, motion, density, and distance. By collecting millions of spectra, SDSS-V is constructing a detailed, three-dimensional map of the Universe while also monitoring selected objects repeatedly. This combination of wide coverage and time-domain observations allows astronomers to study both cosmic structure and rapidly changing phenomena, including stellar activity and the feeding behavior of supermassive black holes.
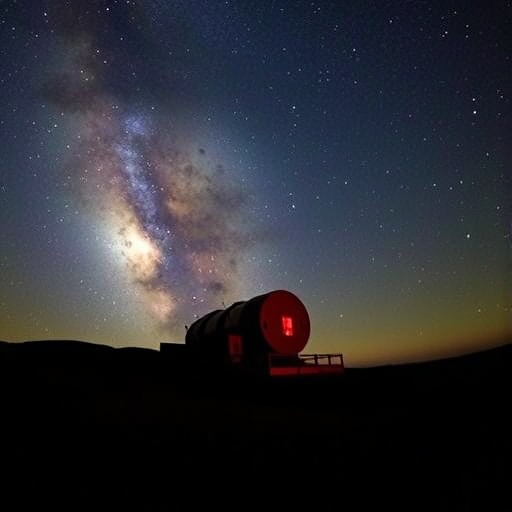
A central achievement of DR20 is the arrival of new BOSS spectroscopy from the du Pont 2.5-meter Telescope at Las Campanas Observatory in Chile. These observations extend the survey’s optical reach into the Southern Hemisphere and complement data collected by the Sloan Foundation 2.5-meter Telescope at Apache Point Observatory in New Mexico. With facilities in both hemispheres, SDSS-V is moving toward a genuinely all-sky spectroscopic survey, enabling researchers to compare stellar populations, galaxies, and interstellar environments across the entire celestial sphere rather than relying primarily on northern observations.
The Black Hole Mapper represents one of the largest components of the release. Its data volume has increased by roughly three to four times compared with Data Release 19, producing approximately 1.1 million optical BOSS spectra for about 500,000 distinct objects. The program includes observations from the All-Quasar Multi-Epoch Spectroscopy project and the Reverberation Mapping program, which repeatedly measures changes in the light from active galaxies. These variations can be used to estimate the scale of the region surrounding a supermassive black hole and to investigate how matter spirals into the central engine of an active galactic nucleus.
DR20 also creates an important link between optical spectroscopy and X-ray astronomy through coordinated observations with the eROSITA X-ray All-Sky Survey. The SPectroscopic IDentification of eROSITA Sources program supplies optical classifications and redshifts for hundreds of thousands of X-ray sources, including active galactic nuclei, galaxy clusters, and magnetically active stars. X-rays often reveal energetic processes that are difficult to detect at visible wavelengths, while optical spectra provide the distance and physical context needed to interpret them. Combining the two types of data gives astronomers a more complete picture of how black holes grow, how clusters assemble, and how stars release high-energy radiation.
The Milky Way Mapper adds a vast new collection of stellar observations. Across the Black Hole Mapper and Milky Way Mapper programs, DR20 contains more than three million spectra representing approximately 1.5 million stars. Spectroscopy allows researchers to determine stellar chemical abundances, temperatures, surface gravities, and motions, creating a powerful record of the Galaxy’s formation history. Among the release’s highlights are the first carbon-enhanced metal-poor stars identified in the Magellanic Clouds and the first intermediate-mass stripped star in the survey. Such rare objects preserve clues about the early chemical evolution of galaxies and the outcomes of binary-star interactions.
Another major advance comes from the Local Volume Mapper, which uses integral field spectroscopy to study nearby regions of the Universe in spatially resolved detail. Rather than producing one spectrum for an entire target, an integral field unit collects spectra from many individual positions across a two-dimensional field. DR20 includes maps of six target regions covering 169 tiles and approximately 300,000 spectra. The observations include Galactic H II regions, planetary nebulae, and nearby galaxies, allowing scientists to trace the temperature, ionization, density, and chemical composition of gas on remarkably fine spatial scales.
The release also makes it easier for the public and researchers to explore these complex datasets. The LVMvis browser-based visualization tool includes an RGB HiPS map built from emission-line observations, allowing users to navigate the distribution of glowing gas across the sky. HiPS, or Hierarchical Progressive Surveys, organizes astronomical images into multiscale tiles that can be viewed efficiently at different zoom levels. In the Orion Nebula and other star-forming regions, the resulting visualizations reveal structures shaped by stellar winds, radiation, shocks, and the birth of new stars. Updated interfaces known as Zora and Valis, along with new scientific tools, provide additional routes into the data.
DR20 is cumulative, meaning it includes the newly reduced BOSS observations obtained through February 2, 2025, together with spectroscopic data from previous stages of the Sloan Digital Sky Survey. Eighteen new or substantially updated value-added catalogs further transform the raw observations into specialized research resources focused on topics such as galaxies, stars, black holes, and the interstellar medium. The complete dataset is available through the SDSS Science Archive Server, while server-based Python notebook tutorials on SciServer Compute are designed to help professional astronomers, students, educators, and independent learners work directly with the observations. By combining all-sky spectroscopy, repeated measurements, spatially resolved maps, and accessible software, Data Release 20 turns the Southern sky into a new laboratory for understanding the Universe.
Article Title: SDSS Data Release 20 Maps the Southern Sky in Unprecedented Detail
Web References: https://dr20.sdss.org/sas/; https://dr20.sdss.org/lvmvis/; https://sdss.org/black-hole-mapper-release-20/; https://sdss.org/milky-way-mapper-release-20/; https://sdss.org/local-volume-mapper-release-20/; https://erosita.mpe.mpg.de/dr2/
Image Credits: Left: SDSS-V, Ivan Katkov, New York University Abu Dhabi, and Sebastian Sanchez, UNAM. Center: SDSS-V, Scott Anderson, University of Washington. Right: SDSS-V, Ilija Medan, University of Toronto.
Keywords
SDSS-V, Data Release 20, BOSS spectroscopy, Southern Hemisphere astronomy, Black Hole Mapper, Milky Way Mapper, Local Volume Mapper, eROSITA, active galactic nuclei, integral field spectroscopy, stellar populations, astronomical data, galaxy mapping
Tags: black hole activity monitoringBOSS spectrograph observationscosmology data releasegalaxy and star observationshigh-resolution sky surveysinterstellar gas analysislarge-scale structure of the universemulti-wavelength cosmic mappingoptical spectral dataSDSS-20 astronomical surveysouthern sky mappingtime-domain astronomy