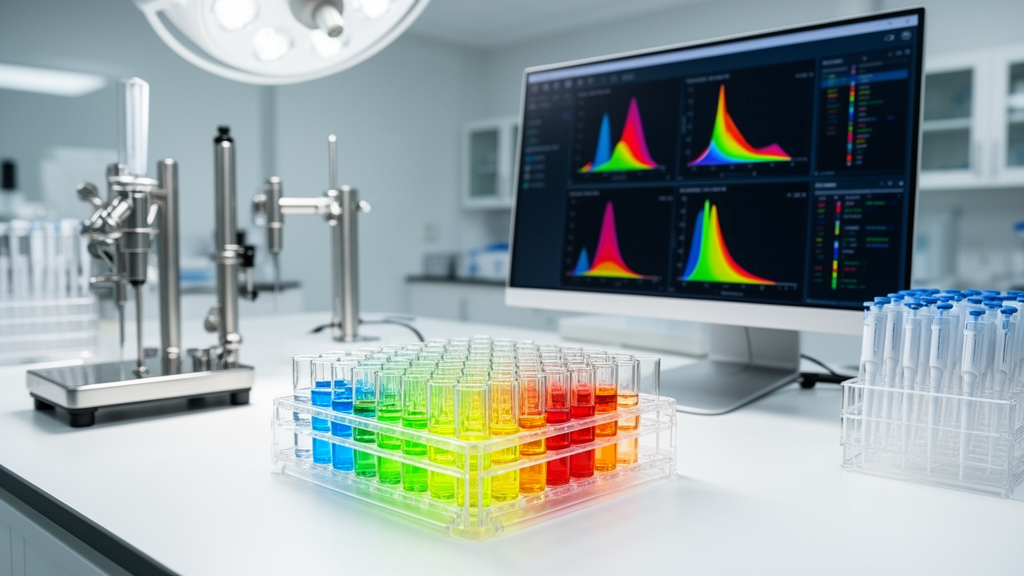
Biomedical researchers frequently rely on multi-well plate assays to conduct experiments ranging from enzyme kinetics and cell viability assessments to antimicrobial screening and high-throughput profiling, yet processing the resulting measurements across multiple files has long depended on error-prone manual spreadsheets.
Plate-based formats represent an indispensable standard across modern life-science laboratories, underpinning enzyme-linked immunosorbent assays, antioxidant evaluations, dose-response characterizations, and absorbance or fluorescence quantification across 96-well and 384-well arrays. These experimental architectures typically generate tabular matrices where individual rows and columns align with physical wells, distinct biological samples, experimental controls, or stepped chemical concentrations. Despite the structural regularity of these assays, downstream data processing is predominantly conducted through ad hoc spreadsheet manipulations in commercial software programs. In these manual routines, bench scientists repeatedly extract raw values, align replicate wells across disparate worksheets, calculate group means, discard anomalous readings through undocumented visual inspection, and construct static charts, introducing substantial operational vulnerabilities into laboratory workflows.
The reliance on manual spreadsheet processing introduces several pronounced technical disadvantages that undermine experimental reproducibility and data integrity. Because manual calculations, cell selections, and plot adjustments are executed interactively without maintaining a codified analytical protocol, third-party reproduction of reported experimental findings becomes exceedingly difficult. Furthermore, manual editing exponentially magnifies the risk of transcription mistakes, misaligned copy-paste operations, and divergent mathematical handling of experimental replicates across distinct plate layouts. As experimental complexity escalates—requiring repeated quantification across extended time courses or large batches of multi-well plates—re-applying identical transformation sequences across dozens of individual spreadsheets becomes exceptionally time-consuming and computationally inefficient for research teams.
While earlier open-source packages have tackled specific facets of microplate data wrangling, existing solutions have generally targeted isolated subroutines rather than providing a unified processing environment. In the computational biology ecosystem, the R package plater focuses primarily on tidying and reorganizing microtiter plate records, whereas the bioassays software package provides discrete functional tools for outlier treatment and statistical fitting. Specialized web utilities like Parsley emphasize parsing heterogeneous plate reader exports to link them with external metadata, and platforms such as Welly concentrate on visualizing microbial growth kinetics. Other analytical tools, including PlateEditor for layout design, DRfit for dose-response modeling, and BactEXTRACT for microbial gene expression data, each occupy distinct niches. PlateMaster differentiates itself by integrating multi-file ingestion, plate-template grouping, cross-file aggregation, auditable filtering logs, and comparative statistical modules within a single browser-accessible interface.
Architecturally, PlateMaster is constructed entirely in Python and deploys the Streamlit framework to power its graphical user interface, making it deployable on local desktop workstations or shared laboratory servers. Analytical data wrangling and numerical calculations are performed using pandas and NumPy, whereas graphical generation is handled through Altair and Matplotlib visualization backends. The application supports standard spreadsheet file formats, including modern Excel workbooks (.xlsx), legacy spreadsheets (.xls), and macro-enabled files (.xlsm), along with compressed ZIP archives containing batches of multi-well experiments. Software execution has been benchmarked on Linux environments using Python 3.13.12, where researchers install project dependencies specified in a requirements configuration and initiate the local server via standard Streamlit execution commands to launch the browser dashboard.
The internal processing workflow begins with a resilient data ingestion layer engineered to accommodate the variable spreadsheet exports generated by diverse laboratory detection instruments. Because microplate spectrophotometers and fluorometers often output idiosyncratic formatting or legacy workbook structures, PlateMaster incorporates automated parser fallbacks that systematically sanitize incoming tables. Upon loading an experimental workbook, the algorithm standardizes table geometry by designating the first column as row identifiers while transforming all remaining matrix coordinates into numerical values. Rows and columns devoid of numerical information are automatically purged from the analytical dataset. To preserve numerical rigor, empty cells and non-numeric values are treated as missing observations and excluded from aggregations without synthetic imputation or artificial zero substitution, ensuring that subsequent statistical power reflects genuine observational counts.
To mirror the physical reality of bench assays, PlateMaster provides an interactive plate-template grouping module where users define experimental treatments across multi-well grids. Laboratory technicians enter categorical labels directly into an editable plate-like matrix interface, where identical text labels automatically link distributed replicate wells into unified experimental cohorts. Users can interactively specify subsets of wells or measurement columns for analytical downstream inclusion, isolating valid experimental sectors from unused or damaged wells before quantitative summarization.
Following group definition, PlateMaster provides a versatile suite of aggregation functions and statistical outlier filtering mechanisms that can be executed prior to data combination. Users can configure analytical summarization modes across experimental groups, including raw preservation without aggregation, mathematical mean, median, minimum, maximum, sum, or sample standard deviation calculations. When anomalous readings arise, the software provides three user-adjustable outlier detection algorithms: interquartile range boundaries, parametric Z-score filtering, and non-parametric median absolute deviation filtering. Rather than silently discarding anomalous values, PlateMaster generates a comprehensive audit log detailing the exact filename, row position, column coordinate, group assignment, and discarded numerical magnitude, alongside aggregate percentage statistics summarizing data exclusion rates across experimental time points.
For inferential group evaluation, the platform integrates automated descriptive and comparative statistical routines designed for exploratory laboratory data screening. The software calculates sample sizes, means, medians, modes, standard deviations, standard errors of the mean, median absolute deviations, extrema, interquartile ranges, and two-sided 95 percent confidence intervals. Two-group comparative evaluations are performed using SciPy’s implementation of Welch’s two-sided t-test, which accommodates unequal sample variances and reports exact p-values alongside Welch-Satterthwaite degrees of freedom. Additionally, two-sided one-sample Student’s t-tests are incorporated to evaluate whether measured group deviations differ significantly from zero. The computational framework computes 95 percent confidence bounds via the t-distribution when sample sizes satisfy n ≥ 2, under the operational assumption of mutually independent observations.
Cross-file temporal visualization represents an essential operational feature of PlateMaster, converting multiple disconnected experimental measurements into unified graphical trends. The platform automatically extracts numerical time markers from input file naming conventions, ordering longitudinal plate files into an integrated temporal sequence. Users can interactively switch between dynamic line plots, scatter plots, bar charts, box plots, and violin distributions, while superimposing error bounds calculated as standard deviations, standard errors, 95 percent confidence intervals, or median absolute deviations. In empirical demonstrations tracking multi-point assay files, aggregated output tables display time points as rows and experimental groups as columns, employing conditional color gradients to contrast signal accumulation against stable negative controls.
Despite its broad utility across spectrophotometric, fluorometric, luminescent, and microbiological assays, the authors note specific architectural boundary conditions and analytical limitations in the software’s initial release. PlateMaster strictly requires input matrices arranged as plate-like tables where the first column contains row labels and the initial row specifies column headers, reading exclusively from the primary worksheet of each uploaded workbook. Furthermore, automated time-point extraction relies on identifying the final numerical sequence in uploaded filenames, which can lead to misinterpretation if filename suffixes contain replicate numbers or sample identifiers rather than chronological intervals. In statistical reporting, the software generates unadjusted p-values intended for preliminary hypothesis generation, meaning users conducting extensive multi-group pairwise comparisons must independently apply false discovery rate or family-wise error rate corrections appropriate for their experimental designs.
By unifying spreadsheet ingestion, template-driven group mapping, transparent outlier accounting, parametric and non-parametric statistics, and publication-ready charting into an accessible no-code web environment, PlateMaster establishes a dependable alternative to manual spreadsheet data management. Distributed under the permissive MIT open-source license, the codebase is publicly accessible via GitHub, accompanied by comprehensive execution documentation, package dependency manifests, and version citation metadata. As life-science laboratories seek to eliminate irreproducibility and transcription errors from routine analytical protocols, structured dashboard architectures such as PlateMaster provide a scalable, transparent framework for transforming raw microplate measurements into verified scientific insights.
Subject of Research: Open-source software for interactive microplate data analysis and visualization
Article Title: PlateMaster: interactive analysis and visualization of plate-based experimental data
Article References: Abelyan, N., & Hovhannisyan, A. (2026). PlateMaster: interactive analysis and visualization of plate-based experimental data. SoftwareX, 36, Article 103212. https://doi.org/10.1016/j.softx.2026.103212
Image Credits: AI Generated
DOI: 10.1016/j.softx.2026.103212
Keywords: PlateMaster, plate-based assays, data visualization, microplate data, Streamlit, Python, open-source software, Welch t-test, outlier filtering, reproducibility, ELISA, laboratory automation, high-throughput screening, bioinformatics, scientific computing, spreadsheet processing
News Source: Denise Maddox. (November 13, 2026). Open-Source PlateMaster Software Automates Multi-Well Experimental Data Analysis and Visualization. Scienmag.