
Credit: PSE Healthy Energy
OAKLAND, CA – Which power plant in your region is the worst polluter and who lives nearby? A new interactive, map-based website launching today (November 15) allows users to explore and analyze data on power plants by viewing information such as location, operations and emissions — alone or in relation to other data, including local demographics and environmental justice indicators. The free site, called the California Power Map, is designed to help users — especially public agencies, researchers, journalists, and citizen groups — access and analyze power-plant data based on their own questions. Physicians, Scientists and Engineers for Healthy Energy (PSE), an Oakland, California-based nonprofit energy science and policy research institute, built the site.
The site includes data on power plants that burn fossil fuels — natural gas, oil or petroleum coke — as well as biomass or biogas, organically derived fuels from sources such as wood and animal waste. Choosing from numerous menus and filters, users can view data such as greenhouse gas emissions and hours of operation and can select geographical regions such as counties or utility service areas. Customized views can be shared as links or displayed as embedded graphics in other sites. Much of the site's information exists in different maps or datasets across federal and State websites but the California Power Map integrates disparate sources of information to allow for easy comparison across datasets.
"These maps help directly answer the kinds of questions I regularly hear, such as: 'In which communities are power plants located? Which plants would we want to take offline if we had alternatives?'" said Elena Krieger, PhD, the director of PSE's clean energy research program, who built the site. "The answers can help inform strategies for shifting to clean energy in an orderly, sensible way, with data-driven decision-making, such as phasing out the most polluting plants in the most populous areas first."
Easy Access to a Trove of Data
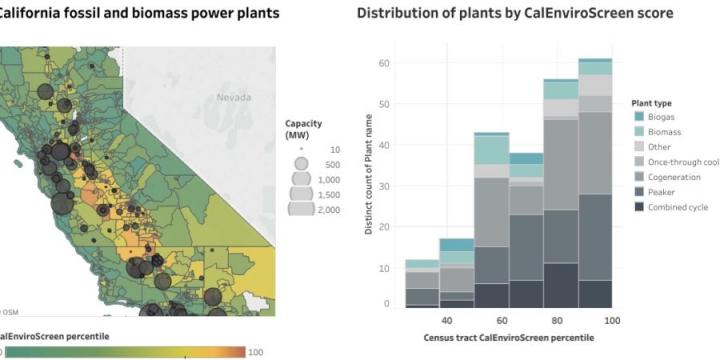
Hovering over a plant reveals the facility's operational and emissions data. Clicking on it reveals deeper information — users can scroll or use tabs to find census tract information, nearby population numbers, demographic data, or CalEnviroScreen scores, an environmental justice rating that quantifies environmental and socioeconomic burdens, such as when communities are particularly vulnerable or exposed to a disproportionate amount of pollution compared to the general population. There are numerous comparative views. For example, users can rank plants by emissions, or by population factors within a 1-, 3-, or 6-mile radius of the plant.
A user interested in understanding how certain types of local plants operate might first look up their utility territory (PG&E, for example), then, under "Plant Type," select the designation "Peaker" — so called because such plants are fired up only during peak-demand periods. These plants emit both greenhouse gases and health-harming co-pollutants and, in some regions, are commonly used on days when air quality already exceeds federal standards. A user could further filter for "Status" to see which peaker plants are slated for retirement or repowering or which ones have the highest rates of emissions for every megawatt-hour of electricity generated.
"You get the most bang for your buck when you displace electricity generation from plants that have high emission rates with cleaner resources, like battery storage facilities charged by solar panels," Krieger said. "Plants designated for repowering — typically old plants slated for replacement with new gas turbines — or retirement help users identify a pending decision-making point where local utilities, governments or communities can consider cleaner alternatives," said Krieger.
Take a walk-through tutorial on this PSE blog post.
User Feedback, Copying Encouraged
Krieger stresses that today's launch is a beta version — she welcomes feedback on problems, bugs and possible data enhancements. In this initial phase of the launch, PSE is providing free training for interested organizations or public agencies, including a planned webinar, on the site's capabilities and more technical options. Interested groups should contact PSE at (510) 330-5550 or [email protected]">[email protected].
PSE scientists expect to add additional information in the future in response to user questions and suggestions, and they are considering expanding some of the visualizations and analyses in the California Power Map to other states. While the website itself cannot be directly replicated for other states – some data sets, like CalEnviroScreen, don't exist outside California — Krieger says the site can serve as a blueprint.
"The California Power Map is essentially a framework for incorporating information about a plant's operation patterns, the environment, and local communities to support informed decisions that help achieve a healthy, equitable transition to clean energy across the power sector," she said.
###
Physicians, Scientists and Engineers (PSE) for Healthy Energy is a nonprofit research institute dedicated to supplying evidence-based scientific and technical information on the public health, environmental and climate dimensions of energy production and use. We are the only interdisciplinary collaboration focused specifically on health and sustainability at the intersection of energy science and policy. Visit us at psehealthyenergy.org and follow us on Twitter @PhySciEng.
Media Contact
Alexander Abu-Hakima
[email protected]
510-330-5551
@PhySciEng
Original Source
https://www.psehealthyenergy.org/news/press-releases/new-website-maps-ca-power-plants-emissions-people/


