
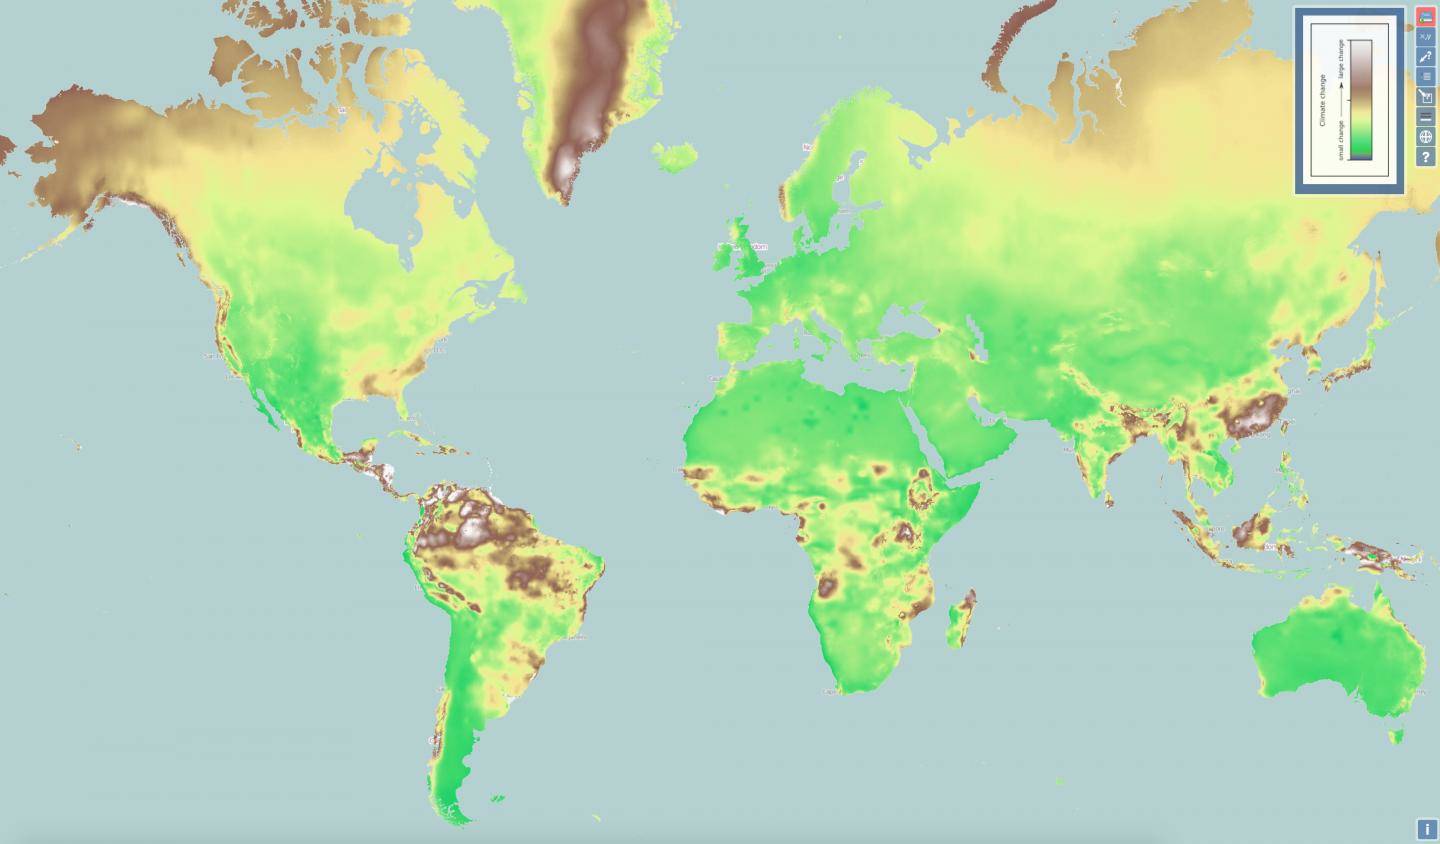
Credit: Tomasz Stepinski/ClimateEx
What does Salt Lake City have in common with Tehran?
More than you might think, if you're a climate scientist.
University of Cincinnati geography professor Tomasz Stepinski created a new interactive map (http://sil.uc.edu/webapps/climateex/) that allows students or researchers to compare the climates of places anywhere in the world. The map draws on five decades of public meteorological data recorded from 50,000 international weather stations around the Earth.
The data is mapped in a 4-square-kilometer grid that gives researchers a visual of what's happening with temperatures and precipitation from pole to pole.
"The map demonstrates climate change over time but also climate diversity. The concept is powerful and can inspire a lot of research," Stepinski said.
Stepinski has spent his career studying spatial, societal and temporal patterns in his Space Informatics Lab in the McMicken College of Arts and Sciences. His late map project in 2017 examined the racial diversity of every neighborhood in America. The digital magazine Quartz called the map "insanely detailed."
Stepinski, a native of Poland, has long been interested in climate and other natural phenomenon that are studied with statistics.
"I've lived in Houston, Tucson and Cincinnati. Climatically speaking, they couldn't be farther apart," he said.
For this project, Stepinski teamed up with Polish researcher Pawel Netzel, who worked in Stepinski's lab at UC. Using monthly records from the public database WorldClim, they developed a visual way for researchers to study patterns and variability of climate over time from locations virtually anywhere in the world.
The map, called ClimateEx, also allows researchers to study what areas of the globe have seen the most dramatic changes in climate over time. Not surprisingly, this includes portions of the warming arctic. But perhaps surprisingly the map also demonstrates that the tropics around the equator also have seen big changes. Stepinski said this is due not to variations in temperature but in monthly rainfall.
"When people think about climate change, they think about temperature: global warming," he said. "But climate has many components, including precipitation. People often consider temperature and precipitation separately. But our mathematical model includes both."
Netzel said the map is especially useful at comparing and contrasting unrelated or geographically distant places since month-to-month weather can vary widely depending on the seasons.
"ClimateEx is mostly an educational tool," Netzel said. "Using ClimateEx, it is easy to get answers to questions such as where in the world do we have a climate similar to Houston's? Where can I find a place with a climate as pleasant as Florida's?"
The map also could help predict which areas will have climates more conducive to extreme weather phenomena such as tornadoes in places where historically there were few, he said.
"ClimateEx enables an easy search for locations where climate change may lead to the occurrence of such extreme phenomena in the future," he said. "The user simply indicates the location where tornadoes are presently frequent and ClimateEx finds all locations where in 50 years the climate will be conducive to tornadoes."
Stepinski and Netzel wrote about their map project in an article this month in the Bulletin of the American Meteorological Society.
"The climate is always changing," Stepinski said. "But it usually changes on a geological timescale. It's not surprising that the climate today is different from the climate a half-million years ago. But now we're experiencing changes on a scale of 100 years. That's a completely different thing."
A warmer climate means there is more energy in the atmosphere. This is leading to increasing frequency and severity of storms and longer droughts according to the U.S. Global Change Research Program, a collaboration of government agencies. That panel's 2017 report concluded that the planet is warming because of human activity, primarily the burning of fossil fuels, since the Industrial Revolution.
"If you were looking at climate change at a scale of a million years, you wouldn't worry too much," Stepinski said. "But if you see dramatic changes on the order of a few decades, it's a big problem. Personally I'm not happy there are people who seem to disregard this as not much of a problem. It is a problem."
Netzel said the map isn't designed specifically for emergency planning. But after seeing what the future might hold, the map could be useful, he said.
"It can support strategic, long-term planning and decision-making on the future development of urbanized space," he said. "It helps to prepare for emerging threats such as increasing the frequency or appearance of extreme weather phenomena. Knowledge about the possibility of hazards will give city planners time to prepare appropriate response plans."
But Stepinski said the map is easy enough to use and understand that ordinary people could use it for more personal reasons like planning their next vacation or contemplating a move to a new city.
So what's the global climate twin of Cincinnati?
Stepinski said it's Vicenza, Italy.
"You will see that both Cincinnati's and Vicenza's climates have a similar progression of weather conditions throughout the year," he said. "So a person would experience the passing of the seasons in the same way in both places."
###
Media Contact
Michael Miller
[email protected]
513-556-6757
@UofCincy
http://www.uc.edu/news
Original Source
http://magazine.uc.edu/editors_picks/recent_features/climatemap.html http://dx.doi.org/10.1175/BAMS-D-16-0334.1


