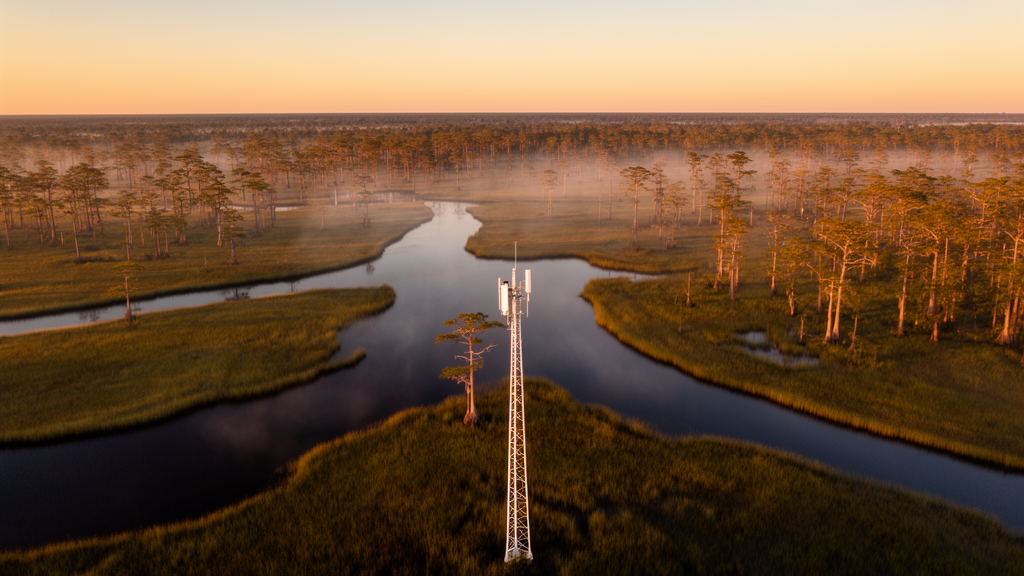
Wetlands across the Southeastern United States absorb roughly 280 teragrams of carbon as carbon dioxide each year while releasing about 233 teragrams back through respiration, leaving a net uptake of around 20 teragrams of carbon annually, according to a new regional assessment that combines machine learning with two decades of environmental data. The same wetlands emitted an estimated 5.7 teragrams of carbon as methane per year between 2000 and 2020, a figure that carries outsized weight because methane traps far more heat per unit of carbon than carbon dioxide.
The study, published in Ecological Processes, was led by researchers including Ana Flavia Brancalion-Costa and Zutao Ouyang, who set out to fill a persistent gap in regional carbon accounting. Although the Southeastern United States has been identified as one of the largest terrestrial carbon sinks in the country, the balance of carbon dioxide and methane fluxes from its wetlands has remained poorly constrained, largely because of strong environmental heterogeneity and the scarcity of regional-scale assessments. Previous work had either focused on a single gas or combined measurements from only a handful of sites without scaling them up spatially.
To build their models, the team compiled monthly observations from 24 wetland sites across the region, drawing on 13 different datasets. Fourteen of the sites used static gas chambers, which are portable and can be deployed densely within a site at biweekly or monthly intervals, while ten relied on eddy covariance towers that provide quasi-continuous, multiyear measurements over a large footprint. The sites included freshwater wetlands and salt marshes, with 18 located in freshwater systems and six in saline or salinity-gradient environments. In total, the compiled dataset contained 318 site-months of net ecosystem exchange data, 581 of ecosystem respiration, 306 of gross primary productivity, and 458 of methane flux, spanning October 2005 to December 2022.
The researchers trained five machine learning algorithms: Random Forest, XGBoost, Support Vector Machine, Artificial Neural Network, and Partial Least Squares Regression. Each model was fed 27 environmental predictors covering climate, vegetation, soil, and hydrological conditions, including air and soil temperature with monthly lags, vapor pressure deficit, solar radiation, water level, soil organic matter, bulk density, and electrical conductance as a proxy for salinity. To test how well the models would generalize to places they had never seen, the team used a leave-one-group-out cross-validation scheme in which an entire site was held out during each training round, a more rigorous test than random data splitting.
Performance varied considerably by gas. Gross primary productivity was the best-predicted flux, with all models achieving correlation-based coefficients of determination between 0.60 and 0.70. Ecosystem respiration and net ecosystem exchange followed, with values ranging from 0.44 to 0.56 and 0.45 to 0.56 respectively. Methane proved hardest to predict, with coefficients between 0.33 and 0.37, a pattern the authors attribute to the skewed distribution of methane fluxes, in which extreme emission events are rare and therefore difficult for algorithms that tend to predict toward the mean. Random Forest and XGBoost were the most consistent performers across fluxes, and the ensemble ultimately excluded Support Vector Machine and Partial Least Squares Regression from the methane model after distribution analyses showed they could not reproduce the observed frequency of fluxes.
Feature importance analyses revealed a clear divide in what drives each gas. Carbon dioxide flux predictions were primarily associated with vegetation and climatic variables, with the Enhanced Vegetation Index, seasonality, and radiation ranking among the most influential predictors of productivity. Methane predictions, by contrast, were more strongly tied to soil and hydrological properties, including organic matter, electrical conductance, pH, and soil water content, reflecting the importance of substrate availability and anaerobic conditions for methane production. The authors caution that these rankings describe predictive contribution rather than direct causal effects, since correlated predictors may share importance.
Using a performance-weighted multi-model ensemble, the team scaled predictions across the entire Southeastern United States at a resolution of 0.1 degrees, roughly 11 kilometers, from 2000 to 2020, multiplying model output by the wetland fraction of each grid cell so that only wetland-covered areas contributed to the estimates. The resulting maps show productivity and respiration hotspots in the Everglades, the Mississippi River Valley, and along the Gulf and Atlantic coasts, with maximum average fluxes near 250 milligrams of carbon per square meter per hour. Net carbon uptake was strongest in the same coastal corridors, while wetlands in the Appalachian region generally showed weaker uptake or even net emissions. Methane emissions were elevated across Florida and coastal Louisiana, with distinct hotspots in coastal North Carolina, where saturated, organic-rich coastal wetlands with warm temperatures and tidal dynamics likely enhance methane production and transport.
Seasonal and interannual patterns emerged clearly from the analysis. All four fluxes peaked in summer, with pronounced hotspots of carbon dioxide uptake in the Mississippi River Delta, the Everglades, the Mobile Delta in Alabama, and the Okefenokee Swamp, and methane emissions concentrated near the Everglades, coastal Louisiana, and coastal North Carolina. Average methane emissions were slightly lower during 2000 to 2007 than during 2008 to 2020, and the years 2005 and 2019 produced the largest methane peaks. The year 2003 stands out as a possible temporary hotspot of regional carbon release, combining the lowest annual productivity and respiration estimates with the second-highest net ecosystem exchange peak and elevated methane emissions, conditions that coincided with negative temperature and vapor pressure anomalies and unusually wet weather.
The authors emphasize several caveats. Water level was treated as a static predictor because no gridded dataset with adequate temporal coverage was available for the full study period, potentially limiting the model’s ability to capture seasonal hydrological fluctuations that influence methane emissions. The models also underestimated the highest observed methane fluxes, meaning hotspot emissions may be underrepresented in the final maps, and regional methane estimates should be interpreted with caution in areas prone to extreme emission events. Because gross primary productivity, respiration, and net ecosystem exchange were modeled independently, a strict carbon mass balance is not guaranteed across the fluxes, and the uncertainty in the net exchange estimate, at minus 20 plus or minus 18 teragrams of carbon per year, remains high. The underrepresentation of coastal observation sites may further limit generalizability in saline and tidally influenced wetlands, and the static wetland distribution used for scaling does not reflect changes in wetland extent over recent decades.
Despite these limitations, the study delivers the first regional scaling of both carbon dioxide and methane fluxes across Southeastern wetlands within a common modeling framework that explicitly represents both freshwater and saltwater ecosystems. The researchers suggest the gridded product can help identify carbon-focused management priorities and restoration opportunities, and pinpoint under-monitored areas with high potential for carbon uptake or emission, such as the Alabama-Mobile region and the Okefenokee Swamp. Because methane’s warming impact per unit of carbon is far greater than that of carbon dioxide, its role becomes more significant when the budget is framed in terms of atmospheric forcing rather than mass, making the combined treatment of both gases a practical step toward more complete regional greenhouse gas inventories.
Subject of Research: Machine learning-based regional estimation of wetland carbon dioxide and methane fluxes across the Southeastern United States
Article Title: Ensemble machine learning-based scaling up of wetland carbon dynamics across the Southeastern U.S.
Article References: Brancalion-Costa, A. F., Farry, E., Kalin, L., Hantush, M. M., & Ouyang, Z. (2026). Ensemble machine learning-based scaling up of wetland carbon dynamics across the Southeastern U.S.. Ecological Processes, 15(1), Article 97. https://doi.org/10.1186/s13717-026-00755-9
Image Credits: AI Generated
DOI: 10.1186/s13717-026-00755-9
Keywords: wetlands, carbon flux, machine learning, methane, carbon dioxide, Southeastern United States, gross primary productivity, ecosystem respiration, net ecosystem exchange, multi-model ensemble, eddy covariance, carbon budget
News Source: Teresa Odom. (October 28, 2026). Machine learning maps wetland carbon fluxes across the Southeastern United States. Scienmag.