A research team led by Dhruval Patel, Dren Qerimi, Scott Dubowsky, Michael Stowell, and David Ruzic has introduced a computational optical emission spectroscopy technique known as the iso-intensity contour method, capable of extracting rotational and vibrational temperatures from molecular emission spectra in just one to two milliseconds. Described in Results in Optics, the methodology overcomes the longstanding trade-off in plasma diagnostics between computational overhead and hardware complexity. In low-temperature plasma processing, such as plasma-enhanced chemical vapor deposition used widely for synthesizing and tailoring thin-film materials, process outcomes are strongly governed by gas and surface temperatures alongside plasma chemistry. Optical emission spectroscopy serves as an appealing, non-intrusive in-situ diagnostic for monitoring these environments because molecular emissions provide direct insights into rotational and vibrational states. However, conventional quantitative interpretation has historically been constrained either by the excessive processing latency required by iterative spectral fitting routines or by the stringent resolution thresholds required by Boltzmann plot methods. The new iso-intensity strategy fundamentally circumvents both barriers simultaneously.
Standard thermometry in non-equilibrium processing discharges predominantly targets diatomic molecular transitions, where gas temperature correlates closely with rotational temperature under partial equilibrium conditions. Historically, researchers have evaluated rotational and vibrational temperatures through two principal methodologies: Boltzmann analysis and forward spectral fitting. Boltzmann analysis evaluates the relative intensities of individual rovibronic spectral lines originating from different upper energy states. Although computationally trivial once individual transition intensities are cataloged, Boltzmann techniques necessitate bulky, expensive, high-resolution spectrometers to isolate closely spaced spectral lines without overlap, alongside labor-intensive manual peak identification that is vulnerable to wavelength drift. Conversely, spectral fitting platforms, including SPECAIR, LIFBASE, and MassiveOES, fit full experimental profiles against simulated theoretical models by iteratively adjusting temperature parameters until convergence. While spectral fitting operates effectively on lower-resolution instrumentation, its reliance on iterative multi-parameter optimization makes it computationally intensive, requiring seconds to several tens of seconds per spectrum. This computational latency forces spectral fitting offline, rendering it impractical for dynamic, real-time feedback control during industrial material processing.
The newly formulated iso-intensity contour method addresses these operational limitations by tracking relative variations in cumulative photon intensities across predefined spectral regions rather than resolving isolated emission lines or running iterative optimization loops. Working with the Second Positive System of molecular nitrogen, corresponding to electronic transitions from the upper C triplet Pi u state to the lower B triplet Pi g state, the researchers synthesized an underlying forward line-by-line spectral model using MATLAB. Within this framework, the net intensity of each rovibrational transition scales proportionally with the population density of the emitting electronic state, the level-specific transition probability determined by Einstein coefficients and Hönl-London factors, and Boltzmann exponential distribution terms spanning vibrational and rotational energies. By selecting three distinct wavelength regions and integrating their cumulative intensities, the team defined a solvable mathematical system where the unknown electronic state population density cancels out completely when computing intensity ratios normalized against a common reference bin, isolating rotational and vibrational temperatures.
Strategic definition of the three integration regions was central to balancing diagnostic sensitivity and physical selectivity across the delta v equals negative two vibrational sequence between 370 and 382 nanometers. The first spectral window, designated Set 1, spans approximately 380.0 to 380.5 nanometers to isolate the first twenty P-branch transitions of the (0,2) vibrational band. The second window, Set 2, covers approximately 375.05 to 375.55 nanometers to capture the first twenty P-branch transitions of the (1,3) band. The third region, Set 3, spans approximately 373.85 to 380.2 nanometers to capture the first forty R-branch transitions of the (0,2) band alongside neighboring rotational features. Crucially, the researchers intentionally permitted Set 3 to partially overlap Set 2, an engineering design choice that substantially increases collected photon counts in the rotational-sensitive channel and stabilizes the resulting intensity ratio under finite spectral resolution without undermining solution uniqueness. Integration window boundaries were symmetrically expanded by twice the full width at half maximum of the instrument line function to absorb experimental broadening.
The computational breakthrough of the iso-intensity approach arises from divorcing heavy simulation calculations from live data evaluation through precomputed contour databases. Prior to measurement, the forward spectral model evaluates a 50 by 50 parameter grid encompassing 2,500 individual simulations spanning rotational temperatures from 500 to 6,500 Kelvin and vibrational temperatures from 500 to 12,000 Kelvin, taking roughly five minutes for low-resolution configurations and thirty minutes for high-resolution setups on graphics hardware. Once constructed, real-time evaluation reduces strictly to executing two trapezoidal numerical integrations across the acquired spectrum and locating the unique geometric intersection point of the corresponding ratio contours via scattered interpolation on a central processing unit. Benchmarked on a standard laptop, the per-spectrum inference executed in merely 1 to 2 milliseconds, demonstrating a speed advantage of three to four orders of magnitude over iterative SPECAIR fitting routines, which consumed several seconds to tens of seconds per spectrum across equivalent wavelength grids.
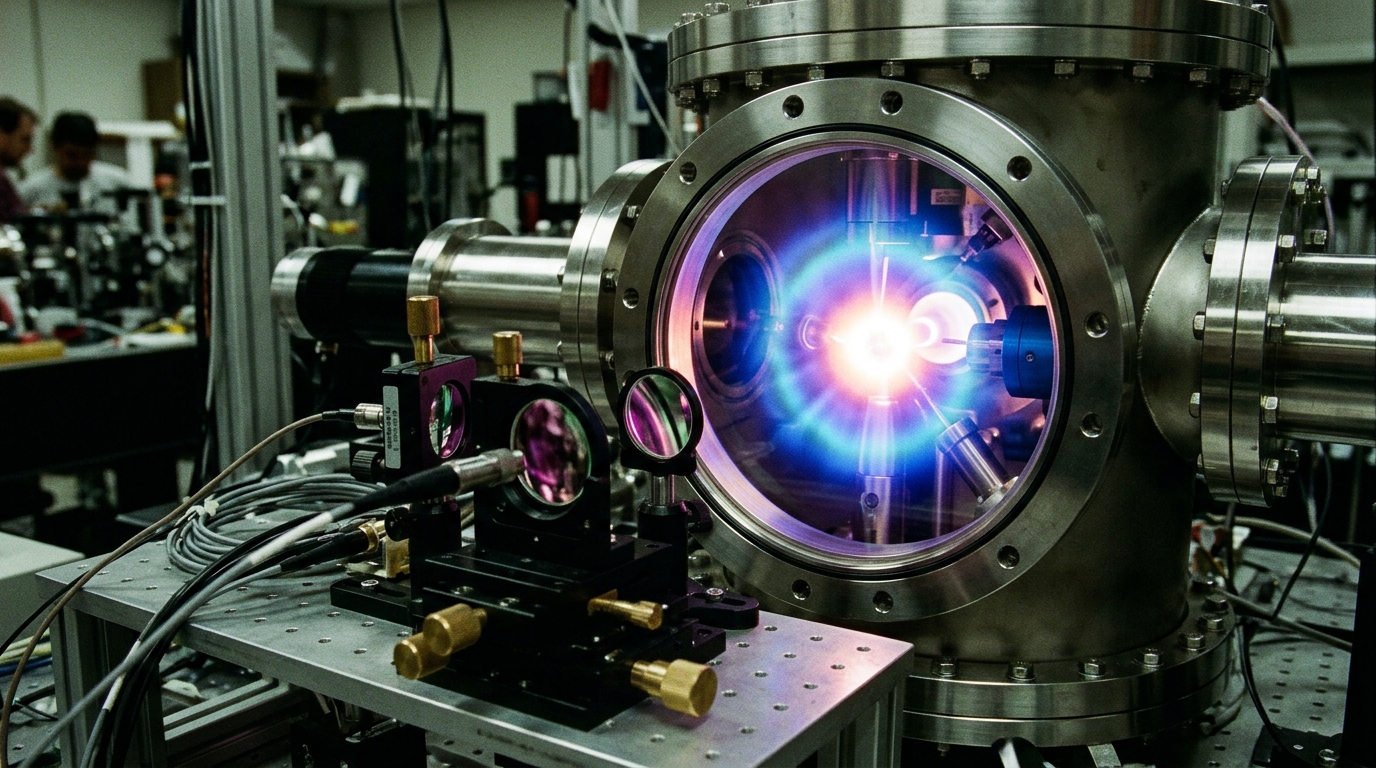
To rigorously evaluate the method under practical laboratory conditions, the authors constructed a low-pressure microwave-driven surface-wave plasma experiment sustained inside a modified Surfatron launcher. The discharge was established within a truncated quartz tube measuring 16 millimeters in inner diameter and 20 millimeters in length, mounted between custom cylindrical flanges attached to a wedged WR340 waveguide structure. A 1,000-watt microwave generator operating at a stable operating pressure of 5.5 Torr delivered power between 70 and 250 watts, while an automated three-stub matching network and sliding short held reflected power below 5 watts. Lateral collection optics focused line-averaged plasma emissions into a multimode optical fiber routed to a 750-millimeter Czerny-Turner spectrograph equipped with a thermoelectrically cooled charge-coupled device. The spectrograph turret housed interchangeable diffraction gratings: a coarse 150 grooves per millimeter grating providing 0.22-nanometer survey resolution and a fine 3,600 grooves per millimeter grating providing 0.008-nanometer high resolution for direct technique comparisons.
Prior to physical plasma experiments, the mathematical accuracy of the iso-intensity contour scheme was validated against idealized synthetic spectra synthesized using SPECAIR across broad temperature regimes. Under noise-free high-resolution synthetic conditions, the rotational temperatures extracted by the contour intersection algorithm matched the known simulation inputs with deviations restricted to within 20 Kelvin. Even when tested against low-resolution synthetic benchmarks where rotational manifolds were thoroughly blended, the recovered rotational temperatures remained within 10 to 100 Kelvin of input values across the full operational range. Vibrational temperature recovery closely followed input values up to approximately 3,000 Kelvin, although progressive deviations emerged at highly elevated vibrational regimes due to minor model parameter discrepancies. Overall, the synthetic benchmarking confirmed that the mapping between calculated intensity ratios and temperature coordinates remains strictly bijective and transversal within the primary target domain of 500 to 1,500 Kelvin for rotation and 3,000 to 10,000 Kelvin for vibration.
Experimental trials carried out in pure nitrogen, nitrogen-helium, and nitrogen-argon discharges confirmed that the iso-intensity method reliably captures thermal scaling trends across applied microwave powers. Across all gas compositions, rotational temperatures increased monotonically as discharge power scaled from 70 to 250 watts, driven by increased joule heating within the plasma core. Pure nitrogen exhibited the steepest thermal elevation, with rotational temperatures climbing from approximately 1,000 Kelvin at low power up to 2,000 Kelvin at 250 watts, attributable to the substantial electron-neutral momentum transfer cross-section of molecular nitrogen. In comparison, nitrogen-helium discharges ranged from 825 to 1,250 Kelvin, while nitrogen-argon discharges spanned 1,350 to 1,650 Kelvin. Rotational temperatures extracted via the iso-intensity method from unresolved, low-resolution spectra aligned remarkably well with high-resolution Boltzmann plots constructed from sixteen isolated rovibronic transitions, showing maximum discrepancies of only 200 to 300 Kelvin, validating low-cost spectrometer applicability.
Investigation of vibrational dynamics revealed pronounced non-equilibrium behavior that highlighted important physical distinctions among spectroscopic diagnostic interpretations. While conventional multi-band SPECAIR fitting and band-head Boltzmann analysis yielded relatively stationary average vibrational temperatures between 6,500 and 9,500 Kelvin across power variations, an explicit two-level effective vibrational temperature tracking the relative populations of the zeroth and first vibrational states revealed a clear downward trajectory with increasing discharge power. In nitrogen-helium mixtures, this two-level metric declined from 13,000 to 10,500 Kelvin, mirroring increased vibrational energy transfer and thermal relaxation driven by elevated neutral gas temperatures. Because the iso-intensity integration windows intentionally isolate transitions originating from the zeroth and first vibrational states, temperatures derived from the iso-intensity method tracked this two-level effective temperature directly, providing physically meaningful monitoring of active vibrational state distributions even in the presence of marked thermodynamic non-equilibrium.
The study also delineated key physical limitations and essential operational safeguards governing industrial deployment of the iso-intensity approach. Because optical spectra represent line-of-sight chord integrations through inhomogeneous plasma volumes, measured values represent emission-weighted averages biased toward the luminous axial core rather than spatially resolved local parameters. Furthermore, foreign spectral interlopers, including cyanide violet bands, hydroxyl radicals, sputtered metal lines, or substrate blackbody continuum radiation, can enter integration windows and systematically bias extracted ratios. The authors establish concrete protocols to ensure fidelity: performing baseline survey scans before deployment, adjusting window boundaries away from known impurities, subtracting adjacent baseline radiation, and monitoring bin discrepancy metrics, which remained below 4 percent for the primary analysis bins throughout testing. These validated safeguards establish the iso-intensity contour framework as a robust, computationally efficient foundation for real-time industrial plasma sensors.
Subject of Research: Rapid optical emission spectroscopy temperature quantification using the isointensity contour method
Article Title: Rapid quantification of temperatures from molecular emission spectra using the isointensity contour method
Article References: Patel, D., Qerimi, D., Dubowsky, S., Stowell, M., & Ruzic, D. (2026). Rapid quantification of temperatures from molecular emission spectra using the isointensity contour method. Results in Optics, Article 101207. https://doi.org/10.1016/j.rio.2026.101207
Image Credits: AI Generated
DOI: 10.1016/j.rio.2026.101207
Keywords: optical emission spectroscopy, plasma diagnostics, isointensity contour method, molecular nitrogen, rotational temperature, vibrational temperature, microwave plasma, process monitoring, Rapid, quantification, temperatures, molecular
News Source: Denise Maddox. (November 6, 2026). Isointensity Contour Method Delivers Millisecond Plasma Temperature Extraction From Emission Spectra. Scienmag.