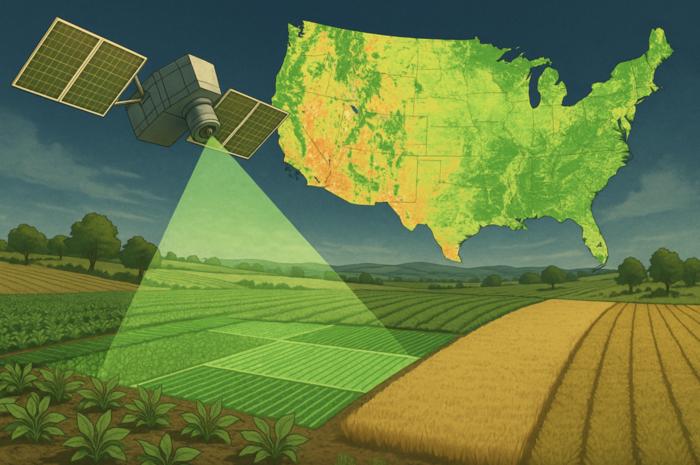
In a groundbreaking advance for environmental monitoring and agricultural management, researchers at the University of Kansas have unveiled a revolutionary web-based application that offers unparalleled satellite-based insights into vegetation and crop health. This innovative tool, known as Sentinel GreenReport Plus, integrates cutting-edge satellite imagery from the European Space Agency’s Copernicus Sentinel-2 mission with powerful climate datasets processed through Google Earth Engine, providing a day-to-day snapshot of vegetation dynamics and environmental conditions across both Kansas and the wider United States. The potential of this application lies not only in its fine spatial resolution but also in its capacity to monitor complex interactions between land cover changes and climatic variables at an unprecedented scale and detail.
Sentinel GreenReport Plus leverages imagery from the Sentinel-2 mission, which consists of a pair of nearly identical satellites following the same orbit, capturing multispectral images of the Earth’s surface at a 10-meter resolution. This is a substantial improvement over previous vegetation monitoring tools that relied on coarse 1,000-meter resolution satellite data, such as MODIS. The finer granularity of Sentinel-2 data allows for exceedingly detailed assessments at the field or plot scale, enabling stakeholders—ranging from agricultural producers and land managers to researchers and policy advisors—to monitor vegetation health and land use changes with remarkable precision. By merging this data with climate information from the PRISM group, the application contextualizes plant health within climatic constraints, offering a holistic view of ecosystem dynamics.
.adsslot_j6Ocz8HLlT{ width:728px !important; height:90px !important; }
@media (max-width:1199px) { .adsslot_j6Ocz8HLlT{ width:468px !important; height:60px !important; } }
@media (max-width:767px) { .adsslot_j6Ocz8HLlT{ width:320px !important; height:50px !important; } }
ADVERTISEMENT
One of the application’s key strengths is its dynamic interface that allows users to interact with data spatially and temporally. Agricultural producers, for instance, can delineate specific fields or areas of interest, select particular crop types as defined by USDA NASS Cropland Data Layers, and instantly visualize time-series charts comparing current vegetation status to historical norms. This interactive capability transforms satellite data from passive imagery into actionable intelligence, enabling timely decision-making about crop management, irrigation scheduling, or yield forecasting. By examining vegetation patterns alongside accumulated precipitation trends, users gain insights into the underlying causes of stress or recovery, distinguishing between environmental water deficits and other potential stressors.
The genesis of Sentinel GreenReport Plus can be traced back to earlier efforts by the Kansas Applied Remote Sensing Program (KARS), which introduced the original GreenReport in 1996 with support from NASA. While the classic GreenReport provided valuable coarse-scale vegetation monitoring using MODIS data, the new platform’s integration of next-generation Sentinel-2 imagery and enhanced climate datasets signifies a quantum leap in capability. The improved resolution enables nuanced assessments that are sensitive to fine-scale heterogeneity in vegetation, supporting applications not only in agriculture but also in ecological restoration, disaster assessment, and wildfire monitoring.
Indeed, the tool has already demonstrated its utility in real-world scenarios. Researchers and land managers have employed Sentinel GreenReport Plus to assess damage following drought episodes, track post-fire recovery trajectories, and monitor vegetation shifts resulting from land-use changes. The capacity to quantify the extent and severity of natural hazard impacts on vegetation fosters more informed responses and management strategies. Moreover, the application’s public accessibility ensures that a broad spectrum of users—from ranchers and cropland producers to educators and policymakers—can harness satellite data once confined to expert domains.
Dana Peterson, director of KansasView and senior research associate with KARS, highlights how advances in satellite remote sensing now enable pixel-level insights that were previously unattainable. The increased spatial resolution provides the capability to differentiate among vegetation types across heterogeneous landscapes, whether in forested areas, rangelands, or croplands. The user-friendly interface lowers barriers to entry, ensuring that stakeholders with varying expertise can access and interpret the data effectively.
An especially compelling feature that distinguishes Sentinel GreenReport Plus is the integration of precipitation data alongside vegetation indices. By portraying precipitation curves in tandem with NDVI time series, the tool offers a powerful interpretive framework for understanding vegetation stress. Users can compare current precipitation against 30-year historical climatology, detecting anomalies that may signal drought. When vegetation health declines occur simultaneously with precipitation deficits, the tool facilitates inference of climate-driven stress, guiding adaptive management decisions and policy formulation.
The impact of Sentinel GreenReport Plus extends beyond immediate agricultural and ecological applications. By enhancing understanding of spatial and temporal patterns of vegetation and climate interplay, it informs broader studies of carbon fluxes, habitat quality, and ecosystem resilience. Policymakers and insurers can leverage the tool’s outputs to evaluate risk, allocate resources efficiently, and develop mitigation strategies for climate-related impacts. Furthermore, researchers can download customized outputs for advanced analyses, enabling the scientific community to build upon this foundational resource.
The public release of Sentinel GreenReport Plus represents a clarion call for greater democratization of remote sensing data and Earth observation tools. Through harnessing cloud computing platforms like Google Earth Engine combined with open-access satellite data and climate products, the University of Kansas team has created a model for transparent, scalable, and impactful environmental monitoring. This platform not only advances scientific understanding but also empowers communities, producers, and decision-makers with timely, high-quality information critical for sustainability in a changing world.
For those interested in exploring the capabilities of Sentinel GreenReport Plus, the application is freely accessible online, offering a robust interface for visualizing vegetation health, tracking land cover changes, and assessing climate anomalies in near real-time. As satellite technology and data analytics continue to evolve, tools like this will become indispensable in navigating the complex challenges of land management, food security, and ecological stewardship in the twenty-first century.
Subject of Research: Satellite-based vegetation and crop health monitoring integrating Sentinel-2 imagery and climate data.
Article Title: Sentinel GreenReport Plus: Revolutionizing Real-Time Vegetation Monitoring with High-Resolution Satellite Imagery and Climate Integration.
Web References:
Sentinel GreenReport Plus Application: https://ks-biosurvey.projects.earthengine.app/view/sentinelgreenreportplus
Copernicus Sentinel-2 Satellite Mission: https://www.esa.int/Applications/Observing_the_Earth/Copernicus/Sentinel-2
Kansas Applied Remote Sensing Program: https://kars.ku.edu
Image Credits: Sentinel GreenReport Plus
Keywords: Sentinel-2, NDVI, vegetation monitoring, crop health, remote sensing, Google Earth Engine, PRISM climate data, land cover change, drought assessment, agricultural technology, precision agriculture, satellite imagery.
Tags: advanced crop monitoring solutionsCopernicus Sentinel-2 missionenvironmental monitoring applicationsfine spatial resolution satellite dataGoogle Earth Engine technologyinnovative agricultural management toolsland cover changes and climate variablessatellite imagery and climate data integrationsatellite monitoring of crop healthSentinel GreenReport Plussustainable agricultural practices in the USvegetation dynamics assessment

