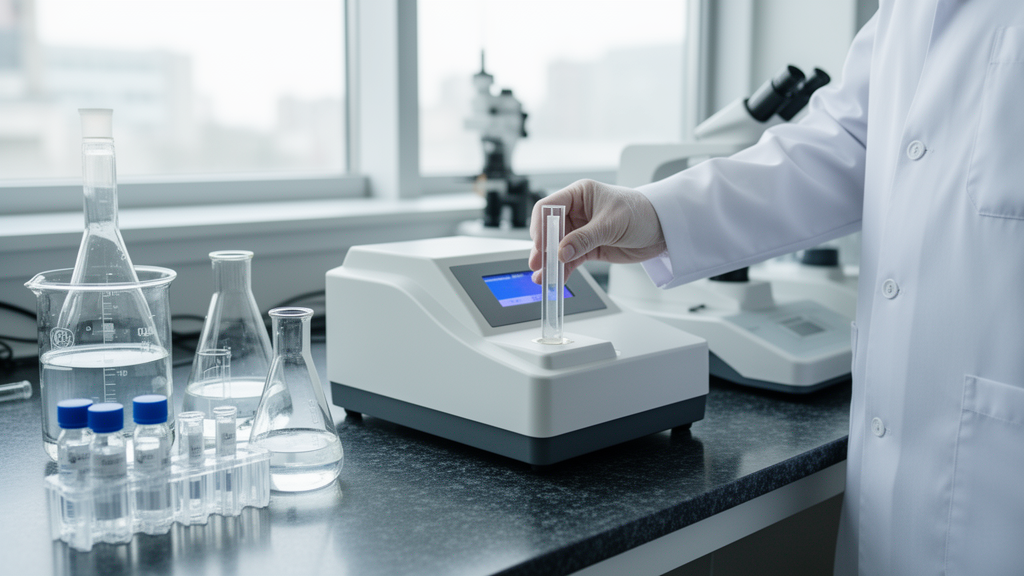
Analytical researchers have established a green ultraviolet spectrophotometric platform integrated with multivariate chemometric modeling to achieve the simultaneous determination of piroxicam and venlafaxine hydrochloride in commercial pharmaceutical tablets and spiked human plasma. The newly reported analytical strategy resolves severe spectral overlap between the two therapeutic agents without requiring chromatographic separation. To date, the only previously reported analytical technique capable of concurrently quantifying this specific pharmaceutical combination relied on reversed-phase high-performance liquid chromatography. While that chromatographic procedure provides reliable analytical separation, it requires continuous electrical power, dedicated instrumentation, and relatively high volumes of hazardous organic mobile phases. By transitioning the analytical procedure to a benchtop double-beam spectrophotometer using an environmentally benign water and ethanol solvent mixture, the investigative team demonstrated that sophisticated mathematical deconvolution can replace resource-intensive chromatographic columns for routine co-formulation quality assurance while providing preliminary proof-of-concept applicability in pretreated biological fluids.
The clinical motivation for developing concurrent quantification protocols stems from the combined administration of piroxicam, a potent nonsteroidal anti-inflammatory drug prescribed for inflammatory and musculoskeletal disorders, and venlafaxine hydrochloride, a serotonin-norepinephrine reuptake inhibitor prescribed for major depression, generalized anxiety disorders, and neuropathic pain. Co-administration of both pharmaceuticals has attracted increasing medical interest, particularly in clinical settings where patients experience debilitating pain-associated depressive conditions requiring concurrent anti-inflammatory and antidepressant management. Alongside therapeutic benefits, growing clinical reports regarding the potential misuse and abuse of formulations containing venlafaxine have intensified regulatory and forensic vigilance. These dual considerations create a distinct necessity for reliable, selective, and sensitive testing procedures capable of verifying dosage uniformity in manufactured dosage forms and monitoring biological specimens without imposing significant chemical waste burdens or operational bottlenecks on testing facilities.
To establish a sustainable analytical platform, the investigators prioritized environmental impact from the earliest stages of solvent screening using standardized green assessment models. Candidate solvents possessing diverse chemical polarities were initially screened using the Green Solvent Selection Tool model. In this preliminary screening, ultra-pure water achieved the highest greenness score of 7.3, followed closely by ethyl acetate at 6.7 and ethanol at 6.6, whereas conventional chromatographic solvents such as methanol and acetonitrile each scored 5.8, and hazardous halogenated solvents like chloroform scored substantially lower. Further characterization through Spider Diagram for Assessment of the Greenness Index analysis evaluated safety, health, and environmental criteria obtained from official Safety Data Sheets. Although ethyl acetate exhibited an acceptable environmental rating, direct spectrophotometric evaluation revealed that absolute ethanol delivered superior absorbance intensities and clearer resolution of intrinsic spectral profiles. Consequently, an equal-volume mixture of ultra-pure water and ethanol in a one-to-one proportion was selected as the universal green solvent for all functional standard preparations and tablet extractions.
Direct spectrophotometric measurement of binary mixtures containing piroxicam and venlafaxine presents severe analytical challenges due to extensive spectral overlap across the ultraviolet spectrum. Zero-order absorption spectra recorded between 200 and 450 nanometers demonstrated that both active pharmaceutical ingredients exhibit strong absorption bands between 210 and 300 nanometers. Conventional univariate spectrophotometric techniques, including derivative spectrophotometry, ratio-spectrum manipulation, dual-wavelength measurements, and absorbance ratio methods, were unable to resolve the individual compounds due to insufficient spectral divergence. For regression-based calibration models, the researchers selected the 210 to 400 nanometer window, yielding 191 discrete wavelength variables sampled at one-nanometer intervals. Wavelengths below 210 nanometers were deliberately excluded to eliminate background absorption and instrumental noise from the solvent system, while wavelengths above 400 nanometers were omitted because they provided negligible quantitative signal. Conversely, multivariate curve resolution retained the complete 200 to 450 nanometer domain to preserve bilinear spectral integrity.
To maximize experimental efficiency and conserve chemical reagents, the research group implemented a rational experimental design strategy combining Brereton’s multilevel calibration framework with an algorithmic Maximin Distance Design for external validation. Rather than assembling excessive empirical mixtures, calibration sets for both pharmaceutical and biological domains were built using 25 systematic binary mixtures. These mixtures distributed five concentration levels independently across the validated working ranges of 5.0 to 30.0 micrograms per milliliter for venlafaxine and 1.0 to 9.0 micrograms per milliliter for piroxicam. To ensure independent verification, 16 validation mixtures were selected through continuous domain sampling optimized by the Maximin Distance Design criterion. This geometric space-filling algorithm iteratively maximizes the minimal Euclidean distance between validation coordinates, preventing spatial clustering and eliminating calibration points. The resulting balanced distribution verified model predictive capacity across boundary, central, and intermediate regions of the analytical space without introducing systematic sampling bias.
The quantitative framework comparatively evaluated six distinct multivariate chemometric architectures representing classical regression, latent-variable modeling, metaheuristic optimization, and curve-resolution methodologies. Classical least squares served as the direct linear benchmark based on additive Beer-Lambert equations across all 191 spectral variables. Latent-variable modeling via principal component regression and partial least squares was implemented to address multicollinearity and spectral redundancy. Leave-one-out cross-validation minimized root mean square error of cross-validation, indicating that three orthogonal latent variables were optimal for both principal component regression and partial least squares. Metaheuristic wavelength selection was incorporated using genetic algorithm-assisted partial least squares and firefly algorithm-assisted partial least squares. These evolutionary algorithms substantially compressed data dimensionality, with the firefly approach discarding uninformative regions to retain only 63 wavelengths for venlafaxine and 74 for piroxicam. Finally, multivariate curve resolution alternating least squares decomposed the raw bilinear data matrix under non-negativity and closure constraints.
External validation conducted on 16 independent test mixtures demonstrated a clear, consistent hierarchy in predictive performance across both analytical matrices. Model precision and accuracy improved progressively following the sequence from classical least squares, through principal component regression, partial least squares, genetic algorithm-assisted partial least squares, and firefly algorithm-assisted partial least squares, to multivariate curve resolution alternating least squares. Classical least squares exhibited the lowest predictive performance due to high sensitivity to collinearity and matrix interference. In pharmaceutical formulations, root mean square error of prediction values decreased from 0.792 to 0.259 micrograms per milliliter for venlafaxine and from 0.201 to 0.071 micrograms per milliliter for piroxicam when advancing from classical least squares to multivariate curve resolution. Bilinear curve resolution yielded the highest predictive accuracy, achieving correlation coefficients of 0.9998 in dosage forms and 0.9996 in plasma, accompanied by relative root mean square errors of prediction below 1.2 percent in commercial formulations.
Method sensitivity was quantitatively evaluated using the Net Analyte Signal approach, which isolates analyte-specific spectral contributions from multicomponent background responses. In pharmaceutical formulations, multivariate curve resolution achieved limits of detection of 0.125 micrograms per milliliter for venlafaxine and 0.029 micrograms per milliliter for piroxicam, with corresponding quantification limits of 0.378 and 0.087 micrograms per milliliter. Recovery experiments across three fortification levels yielded mean recoveries between 99.48 and 99.85 percent for venlafaxine and 99.45 to 99.87 percent for piroxicam in tablet validation sets. Repeatability relative standard deviations remained below 0.74 percent, while intermediate precision across three consecutive days remained below 0.83 percent. Robustness testing deliberately varied spectral bandwidth, scanning speed, and cuvette positioning, confirming stable recoveries between 98.0 and 102.0 percent with relative standard deviations not exceeding 2.0 percent.
Statistical evaluation confirmed the accuracy, trueness, and equivalence of the chemometric models. Student’s t-tests revealed that calculated t-values across all models remained well below critical values at the 95 percent confidence level, establishing that recoveries did not differ significantly from the ideal 100 percent benchmark. One-way analysis of variance comparing the six chemometric models against the established chromatographic reference method yielded variance ratios of 1.742 for venlafaxine and 1.964 for piroxicam in tablet matrices, with p-values of 0.158 and 0.103. Because all calculated F-values were below the critical threshold of 2.445 and all p-values exceeded 0.05, the analytical outcomes demonstrated statistical equivalence. Complementary Elliptical Joint Confidence Region analysis plotted regression slopes and intercepts, confirming that the ideal theoretical point containing an intercept of zero and a slope of one was fully encompassed within the 95 percent confidence ellipses for the curve resolution model without constant or proportional bias.
The developed procedure was subsequently applied to quantify the active constituents in commercial Rytreka tablets, labeled to contain 75 milligrams of venlafaxine and 25 milligrams of piroxicam. Following ultrasonic extraction in the water-ethanol solvent system and membrane filtration, direct assays yielded mean recoveries between 98.42 and 99.91 percent for venlafaxine and 98.06 to 99.81 percent for piroxicam. Standard addition experiments fortifying tablet matrices at 80, 100, and 120 percent of nominal concentrations produced recoveries ranging from 98.84 to 100.12 percent. These findings confirmed that common excipients do not interfere with spectrophotometric quantification. Application to drug-free human plasma spiked with both compounds required protein precipitation using methanol followed by evaporation and reconstitution in water and ethanol. In fortified plasma, mean recoveries spanned 95.18 to 98.94 percent for venlafaxine and 94.04 to 98.83 percent for piroxicam, with matrix effect evaluations indicating negligible signal suppression between negative 0.7 and negative 2.0 percent.
Comprehensive sustainability benchmarking benchmarked the spectrophotometric assay against the previously published liquid chromatographic method across nine independent greenness and applicability frameworks. The proposed method satisfied all National Environmental Methods Index green criteria and achieved a higher Analytical GREEnness score of 0.76 compared to 0.52 for liquid chromatography. Carbon footprint assessment demonstrated an 78 percent reduction in carbon dioxide equivalents, dropping from 0.066 to 0.014 kilograms per sample run. Practical applicability scores via the Blue Applicability Grade Index favored the spectrophotometric technique with an 80 versus 70 rating, while holistic assessments through the Red-Green-Blue twelve-parameter tool yielded an 88.2 versus 69.6 score. Despite these operational and environmental advantages, the authors emphasized that the biological matrix investigations represent a preliminary proof-of-concept rather than a complete bioanalytical validation. Comprehensive clinical implementation, pharmacokinetic monitoring, and therapeutic drug surveillance will require further validation on incurred clinical specimens from diverse donor populations to rigorously evaluate metabolite interference, long-term stability, and physiological matrix variability.
Subject of Research: Simultaneous spectrophotometric and chemometric determination of piroxicam and venlafaxine
Article Title: Holistically benchmarked optimization-assisted green spectrophotometric–chemometric approach for simultaneous determination of piroxicam and venlafaxine in pharmaceutical formulations and spiked human plasma
Article References: Alsfouk, B. A., Al-Khatee, L. A., Al kamaly, O., Tantawy, M. A., Khashoqji, M. M., Halim, M. K., Barghash, S. S., & Abbas, A. E. F. (2026). Holistically benchmarked optimization-assisted green spectrophotometric–chemometric approach for simultaneous determination of piroxicam and venlafaxine in pharmaceutical formulations and spiked human plasma. BMC Chemistry, 20(1), Article 193. https://doi.org/10.1186/s13065-026-01929-4
Image Credits: AI Generated
DOI: 10.1186/s13065-026-01929-4
Keywords: analytical chemistry, green chemistry, spectrophotometry, chemometrics, piroxicam, venlafaxine, pharmaceutical analysis, multivariate calibration, MCR-ALS, Holistically, benchmarked, optimization-assisted
News Source: Bethany Barker. (November 11, 2026). Green Spectrophotometric Method Quantifies Piroxicam and Venlafaxine Using Chemometric Modeling. Scienmag.