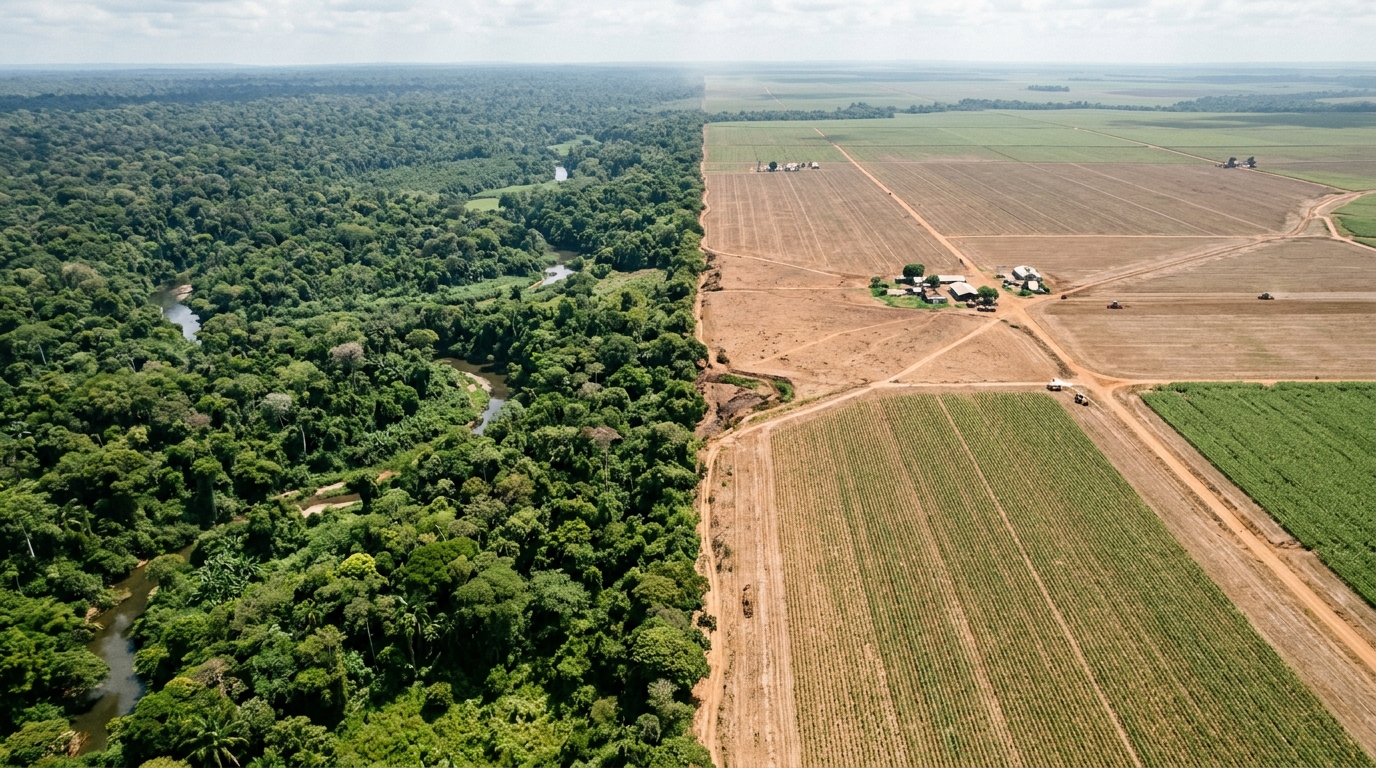
A new study published in the Journal of Industrial Ecology quantifies the biodiversity footprint of public procurement in Finland for the year 2022, revealing that the majority of the environmental impact is located outside the country’s borders. The research, conducted by Essi Pykäläinen, Sami El Geneidy, and Janne S. Kotiaho, utilized a consumption-based model to assess how government spending on goods and services contributes to global biodiversity loss. The findings indicate that over 90% of the biodiversity footprint associated with Finnish public procurement was situated overseas, highlighting the significant role of global value chains in driving ecological impacts far from the point of purchase.
The study employed the Biodiversity Equivalent Impact Assessment method, known as BIOVALENT, to estimate the potential extinction risk for global species resulting from public sector spending. This approach combines data from the EXIOBASE database, which tracks international economic flows, with the LC-IMPACT life cycle impact assessment method. By linking monetary consumption to environmental pressures such as land use, climate change, pollution, and water stress, the model calculates the potentially disappeared fraction of species across terrestrial, freshwater, and marine ecosystems. The results are aggregated into a single indicator called the biodiversity equivalent, which represents the fraction of global species at risk of irreversible extinction.
In 2022, the Finnish public sector procured goods and services worth 44.7 billion euros, with the assessment covering 28.7 billion euros of this expenditure. The total biodiversity footprint calculated for this procurement was 24,259 nano-biodiversity equivalents, equating to a potential extinction risk of 2.4 times 10 to the power of negative 5 for global species. The study found that the government, municipalities, and joint municipal authorities each contributed significantly to this footprint, with over a quarter of the impact attributed to the government and less than half to municipalities. This distribution underscores the broad reach of public procurement in influencing environmental outcomes across different levels of administration.
Construction and maintenance services emerged as the largest contributor to the biodiversity footprint, accounting for 19% of the total impact in 2022. This category represented only 12% of the total expenditure, indicating a disproportionately high environmental burden per euro spent. Utilities, including electricity, heating, and water consumption, were the second largest contributor at 15% of the footprint, also representing 12% of expenditure. Health and social services and medical and care supplies followed as the third and fourth largest contributors, with shares of 11% and 10% of the biodiversity footprint, respectively. These categories highlight specific areas where public spending has a substantial ecological cost.
The drivers of biodiversity loss varied by ecosystem type. In terrestrial ecosystems, climate change was the dominant driver, responsible for 53% of the impacts, followed by land use at 42% and pollution at 5%. For freshwater ecosystems, climate change also accounted for the majority of impacts at 51%, with water consumption contributing 47% and pollution 2%. Marine ecosystems were primarily affected by pollution, specifically eutrophication due to nitrogen emissions. The geographical distribution of these impacts was widespread, with land use impacts concentrated in small island nations near the equator, while pollution impacts were significant in regions such as the United Arab Emirates, India, and China.
The study identified specific procurement categories as priorities for mitigation efforts using a quadrant of opportunities analysis. This tool categorizes spending based on impact factor and expenditure volume to identify where mitigation strategies would be most effective. Construction and maintenance services, utilities, medical and care supplies, machines and appliances, and accommodation and catering services were identified as high-priority categories. These categories were selected because they combine high environmental impact with significant expenditure, offering the greatest potential for reducing biodiversity loss through strategic procurement changes. The analysis suggests that targeting these areas could yield the most significant reductions in the overall footprint.
Despite the clear identification of high-impact categories, the study acknowledges several limitations and uncertainties in the assessment. The sensitivity analysis revealed that the estimated biodiversity footprints could vary substantially depending on the specific product categories selected from the EXIOBASE database to represent financial accounts. For instance, alternative scenarios for construction and maintenance services showed deviations of up to 44% from the original assessment. This variability highlights the challenges of matching coarse financial data to detailed environmental impact models. The authors emphasize that while absolute values may be sensitive to methodological choices, the relative strategic priorities identified remain robust and useful for guiding further action.
The geographical concentration of impacts outside Finland reflects the nature of the biodiversity equivalent indicator, which measures the risk of global species extinction rather than local ecological damage. Finland hosts a relatively low number of endemic or globally threatened species compared to countries with higher endemism, such as those in tropical regions. Consequently, the model assigns lower vulnerability scores to impacts within Finland, directing the majority of the calculated extinction risk to regions with higher biodiversity richness. This finding underscores the transboundary nature of biodiversity loss, where consumption in one country can drive species extinction in another, emphasizing the need for global cooperation in addressing environmental challenges.
The study also notes that the current databases used for the assessment have limited coverage of certain impacts, particularly in marine ecosystems. Only eutrophication from nitrogen emissions was included for marine biodiversity, while other significant pressures such as climate change, sea use, and plastic pollution were not fully captured. Additionally, impacts from invasive alien species and direct exploitation of natural resources in terrestrial and freshwater ecosystems are not yet incorporated into the model. The authors argue that expanding these databases to include a broader range of impact pathways is essential for a more comprehensive understanding of biodiversity footprints. Future research should focus on operationalizing existing scientific knowledge into standardized assessment frameworks to improve the accuracy and scope of these evaluations.
The implications of this study extend beyond Finland, as public procurement accounts for 13% to 20% of global gross domestic product, making it a significant driver of environmental impacts worldwide. The findings suggest that public authorities have a substantial opportunity to influence sustainability through their purchasing decisions. By prioritizing mitigation efforts in high-impact categories and adopting more sustainable procurement practices, governments can contribute to the goals of the Global Biodiversity Framework. The study provides a foundational assessment that can guide more detailed, category-specific investigations and the implementation of targeted mitigation strategies. Ultimately, the research highlights the critical role of the public sector in driving transformative changes across value chains to reduce biodiversity loss and promote a more sustainable global economy.
The assessment excluded specific financial accounts to prevent double counting and to focus on relevant biodiversity drivers. Internal procurements between public entities, such as client services provided by one municipality to another, were removed from the analysis. According to Statistics Finland data cited in the study, this exclusion amounted to 13.5 billion euros for municipalities and 1.8 billion euros for joint municipal authorities in 2022. Other excluded categories included purchases and rents of land and water areas, building purchases, per diem allowances, and patent or license fees. In total, 16 billion euros of expenditure was excluded from the final footprint calculation, with 84% of this amount attributable to municipalities and 11% to joint municipal authorities. The data covered 64 governmental procurement organizations, 287 out of 309 municipalities, and 124 joint municipal authorities in mainland Finland. The 16 municipalities in the Åland Islands were excluded due to their autonomous status and distinct reporting system, while six mainland municipalities were omitted because their data were unavailable in the public database.
The BIOVALENT method calculates the biodiversity equivalent by weighting the potentially disappeared fraction of species across three ecosystem types. The weights are based on the estimated shares of global plant and animal species richness for each ecosystem. Terrestrial ecosystems are assigned a weight of 0.801, freshwater ecosystems 0.096, and marine ecosystems 0.102. This weighting scheme allows for the aggregation of ecosystem-specific impacts into a single indicator that represents the fraction of global species at risk of extinction. The study notes that the time component of the indicator remains a subject of ongoing scientific debate, so the unit is reported as biodiversity equivalents rather than including a time suffix. The impact factors used in the calculation are expressed in femto-biodiversity equivalents per euro, reflecting the small magnitude of the extinction risk associated with individual procurement items.
The geographical distribution of impacts reveals specific hotspots for different drivers of biodiversity loss. Land use impacts on terrestrial ecosystems were highest in small island nations close to the equator, with Guam, São Tomé and Príncipe, Seychelles, North Mariana Islands, and New Caledonia collectively accounting for 24% of these impacts. Finland accounted for only 3.5% of land use impacts, while Russia and Indonesia had shares of 3.1% and 2.4%, respectively. Pollution impacts on terrestrial ecosystems were most significant in the United Arab Emirates, which held an 18.8% share, followed by the Palestinian Territories, Italy, Lebanon, and Papua New Guinea. Water consumption impacts on freshwater ecosystems were concentrated in the United States, which accounted for 21.4% of the total, followed by Australia, Brazil, China, Russia, and Botswana. Finland’s share of water consumption impacts was minimal at 0.1%.
Marine ecosystem impacts were primarily driven by eutrophication due to nitrogen emissions. China accounted for the largest share of these impacts at 38.3%, followed by Germany at 32.6%. The Netherlands, Finland, Sweden, and the United States also contributed significant shares. The study notes a potential data anomaly regarding Estonia, where the characterization factor in the LC-IMPACT database was significantly higher than for any other country. Although this value could be considered an outlier, the authors reported the original results to indicate existing uncertainties in current assessment methodologies. This decision highlights the importance of transparent reporting when dealing with potential errors in underlying databases. The exclusion of Estonia from the geographical visualization of marine impacts was noted to avoid skewing the visual representation of the data.
The quadrant of opportunities tool uses median values for impact factor and expenditure to divide procurement categories into four sections. Categories in the first quadrant have high impact factors and high expenditure, making them the highest priority for mitigation. Mitigation in these categories can be achieved by replacing products with more sustainable alternatives or by reducing overall consumption. The second quadrant includes categories with high impact factors but low expenditure, where choosing alternative low-impact products is the most effective strategy. The third quadrant contains categories with low impact factors but high expenditure, where reducing consumption is the primary mitigation lever. The fourth quadrant includes categories with low impact factors and low expenditure, where mitigation opportunities are relatively limited. The tool also includes dashed lines representing equal-share thresholds for the total biodiversity footprint, aiding in the interpretation of individual category contributions.
Subject of Research: Biodiversity footprint of public procurement in Finland
Article Title: Biodiversity footprint of public procurement in Finland
Article References: Pykäläinen, E., El Geneidy, S., & Kotiaho, J. S. (2026). Biodiversity footprint of public procurement in Finland. Journal of Industrial Ecology. https://doi.org/10.1007/s44498-026-00200-2
Image Credits: AI Generated
DOI: 10.1007/s44498-026-00200-2
Keywords: Biodiversity, footprint, public, procurement, Finland, scientific research
News Source: Margaret Porter. (November 7, 2026). Finland’s Public Procurement Biodiversity Footprint Mostly Overseas. Scienmag.