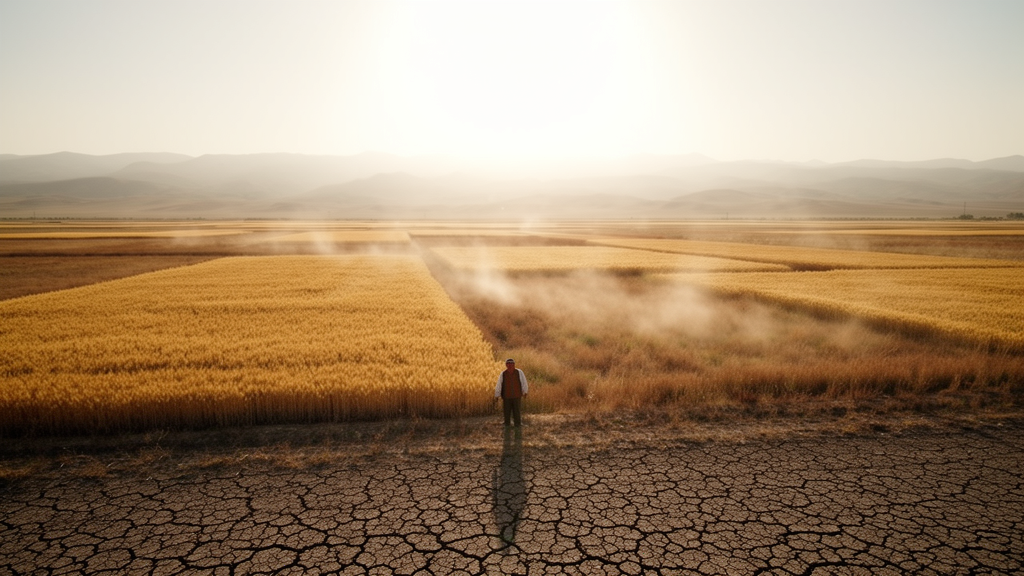
Expanding farmland across the semi-arid grasslands of northern China does not raise drought risk gradually. According to a new study published in Ecological Processes, once cultivated land covers more than about 40% of a landscape, agricultural drought stress jumps by 82% and the joint probability of drought and heatwave striking together rises by 375%, compared with landscapes where cultivation stays below roughly 17%. The work, led by Yuejuan Yang and Hao Zhang with colleagues including Zhijian Li, quantifies these tipping points in the Horqin Sandy Land Ecological Conservation Area, a typical agro-pastoral ecotone in eastern Inner Mongolia.
The research team analyzed 50 grid cells, each 0.125 degrees square, spanning five land-use patterns in which cultivated land ranged from 6.4% to 70.62%. Because the study compared spatially distinct cells rather than tracking change over time, it used a space-for-time substitution design, and the authors explicitly frame their findings as statistical associations rather than direct causal proof. To validate that substitution, they tested climatic homogeneity across the cells: during the 2018–2023 growing seasons, coefficients of variation for air temperature, precipitation, and mean elevation were all below 10%, at 9.1%, 8.7%, and 6.9% respectively, indicating minimal spatial heterogeneity among the sampled units.
The study period covered the growing seasons of 2018 through 2023, drawing on multi-source MODIS satellite data. Surface albedo came from the MCD43A3 product, evapotranspiration from MOD16A2, and land surface temperature from MOD11A2 under clear-sky conditions. Downward shortwave radiation was obtained from ERA-Interim reanalysis at the 0.125-degree grid scale, and data accuracy was checked against observations from 756 ground stations operated by the National Meteorological Information Center. Land-use maps for 2018 and 2023 at 30-meter resolution came from the Chinese Academy of Sciences monitoring database, and cells were selected only where cultivated land plus grassland together exceeded 80% of the area, to avoid confounding from other land-cover types.
Global sensitivity analysis using the eFAST method revealed that surface temperature was the primary determinant of the surface energy balance, with a first-order sensitivity index of 0.54. Total-order indices for surface temperature, NDVI, and albedo reached 0.95, 0.83, and 0.42, pointing to strong interaction effects among these parameters. Partial correlation analysis showed that latent heat flux, the flux associated with evapotranspiration, had a significant negative correlation with surface temperature change, with coefficients strengthening from −0.39 in June to −0.58 in September, while radiative forcing showed only a positive but nonsignificant correlation. In other words, evaporative cooling, not reflection of sunlight, was the dominant control on surface temperature in this system.
Fitting logistic curves between cultivated land proportion and evapotranspiration for June, July, and August, the researchers identified month-specific thresholds where evapotranspiration growth rates shifted markedly: 16.74% in June, 22.29% in July, and 19.48% in August. Peak evapotranspiration at those thresholds reached 11.87, 17.01, and 13.94 mm per day respectively. Beyond these points, evapotranspiration approached equilibrium at a cultivated land proportion of 40%. Bootstrap resampling with 1,000 iterations produced narrow 95% confidence intervals for all thresholds, with the July threshold showing the highest stability at a coefficient of variation of 4.89%, and sensitivity analyses showed threshold variations stayed below 2% even after excluding the 10% most extreme data points.
The drought-vulnerability analysis relied on the Temperature–Vegetation Drought Index, or TVDI, which integrates surface temperature and vegetation greenness, with higher values indicating greater drought stress. Grid cells below the June threshold of 16.74% cultivated land maintained a mean TVDI of 0.38 ± 0.09, indicating minimal drought stress. In the transitional zone between 16.74% and 22.29%, TVDI rose to 0.52 ± 0.11, a 37% increase. The moderate zone, from 22.29% to 40%, reached 0.61 ± 0.09, corresponding to moderate drought stress. Above the 40% saturation point, mean TVDI hit 0.69 ± 0.10, an 82% increase over the below-threshold zone, with a bootstrap 95% confidence interval of 61% to 103% from 1,000 iterations. A logistic regression of TVDI against cultivated land proportion independently placed the inflection point at 38.52%, with a 95% confidence interval of 35.28% to 41.76%, closely aligning with the 40% threshold derived from evapotranspiration.
Interannual patterns reinforced the picture. During the extreme drought of 2020, the saturation zone reached a TVDI peak of 0.84 ± 0.08, indicating persistent severe agricultural drought in July and August, while the below-threshold zone stayed at 0.49 ± 0.12. The saturation zone also showed greater interannual variability, with a coefficient of variation of 18.3% versus 11.2% below the threshold. SPEI-based drought-frequency analyses over 2000–2023 corroborated these patterns: the below-threshold zone averaged 2.3 ± 1.1 drought events per growing season, compared with 5.3 ± 1.8 in the saturation zone, a 130% increase with a bootstrap 95% confidence interval of 68% to 192%.
For composite disaster risk, the team used a Gaussian copula model to estimate the joint probability of concurrent drought, defined as TVDI above 0.6, and heatwave events, identified when daily maximum land surface temperature exceeded 35 °C for at least three consecutive days during June through August. That joint probability climbed from 0.08 ± 0.03 in the below-threshold zone to 0.38 ± 0.08 in the saturation zone, the 375% increase, with a bootstrap 95% confidence interval of 189% to 561%. Risk classification using a Composite Risk Index, which weights normalized TVDI and drought frequency at 0.4 each and cultivated land proportion at 0.2, sorted the 50 cells into eight low-risk, 28 moderate-risk, and 14 high-risk units. Cross-validation against historical agricultural disaster records from the China Meteorological Disaster Yearbook for 2018–2023 showed that high-risk cells lost a mean of 18.4 ± 6.2% of cultivated land area in drought years, versus 6.7 ± 3.1% for moderate-risk and 3.2 ± 1.8% for low-risk cells.
Partial least squares discriminant analysis of ecosystem-service values, estimated with the Costanza framework and Chinese coefficient sets, achieved a classification fit of R² = 0.93 across the five land-use patterns. Three services stood out as most responsive to threshold-based categorization: soil conservation with a VIP score of 1.48, climate regulation at 1.18, and waste treatment at 1.06, all above the significance threshold of 1. Patterns 4 and 5, the most cultivated configurations, sat closest to ecosystem-service loss indicators, and the authors argue this convergence of independent analytical pathways on closely aligned threshold estimates supports the thresholds as an underlying ecological reality rather than an artifact of any single method.
The authors propose a staged management framework: strict conservation below 16.74% cultivated land, adaptive management between 16.74% and 40%, and intensive restoration above 40%, where the drought–heatwave joint probability is sharply elevated. They also note important limitations. The six-year observational record falls within a single predominantly dry phase and may not capture longer precipitation cycles of roughly 7–11 years typical of these semi-arid regions, so the thresholds could shift under prolonged wet phases. The analysis treated cultivated land as homogeneous without distinguishing crop types or management intensity, and the 0.125-degree grid may mask fine-scale heterogeneity. Under projected warming of 1.5–2.0 °C by 2050, increased atmospheric evaporative demand may lower the safe threshold to roughly 12–14%, expanding the area at risk. The authors emphasize that operational deployment would require local recalibration of TVDI edges and thresholds with region-specific ground observations, since the values are calibrated for the Horqin Sandy Land and may not transfer directly to other agro-pastoral ecotones.
Subject of Research: Threshold effects of cultivated land expansion on drought vulnerability and compound drought–heatwave risk in an agro-pastoral ecotone of northern China
Article Title: Threshold effects of cultivated land expansion in agro-pastoral ecotones: non-linear amplification of drought vulnerability and composite disaster risk
Article References: Yang, Y., Zhang, H., Yin, Z., Zhao, X., Liu, Y., Ji, H., & Li, Z. (2026). Threshold effects of cultivated land expansion in agro-pastoral ecotones: non-linear amplification of drought vulnerability and composite disaster risk. Ecological Processes, 15(1), Article 98. https://doi.org/10.1186/s13717-026-00756-8
Image Credits: AI Generated
DOI: 10.1186/s13717-026-00756-8
Keywords: agro-pastoral ecotone, cultivated land threshold, drought vulnerability, heatwave, evapotranspiration, TVDI, Horqin Sandy Land, land-use change, composite disaster risk, Gaussian copula, ecosystem services, space-for-time substitution
News Source: Drew Townsend. (October 28, 2026). Cultivated land past 40% sharply amplifies drought and heatwave risk in northern China’s agro-pastoral ecotone. Scienmag.